Download
1 / 33
340 likes | 450 Views
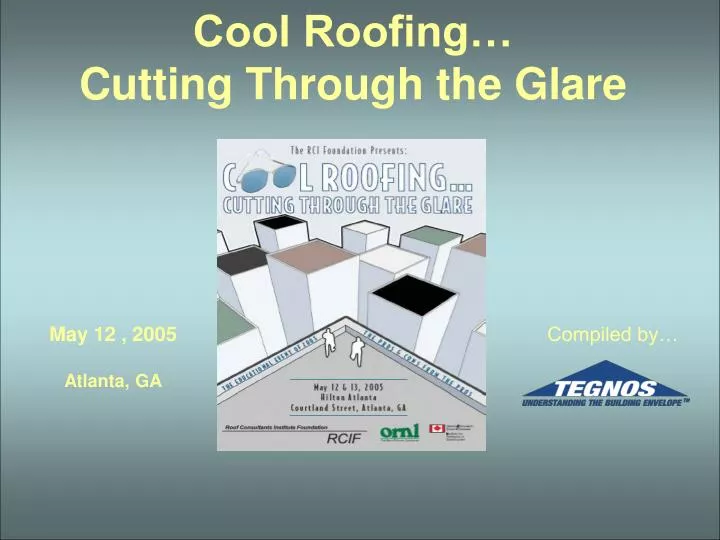
Cool Roofing… Cutting Through the Glare. May 12 , 2005 Atlanta, GA. Compiled by…. Cool Roofing… Cutting Through the Glare. Sponsored by Roof Consultants Institute Foundation (RCIF) Oak Ridge National Laboratories (ORNL) National Research Council of Canada (NRC) Attended by

E N D
Cool Roofing… Cutting Through the Glare May 12 , 2005 Atlanta, GA Compiled by…
Cool Roofing… Cutting Through the Glare • Sponsored by • Roof Consultants Institute Foundation (RCIF) • Oak Ridge National Laboratories (ORNL) • National Research Council of Canada (NRC) • Attended by • Over 200 construction and design professionals • Industry media & trade associations • Presented by • 30 researchers from universities, government, industry
Cool Roofing…Cutting Through the Glare Key Symposium Topics • Environmental Issues • Design Issues • Economic Issues
Cool Roofing…Cutting Through the Glare Cool Roofs & the Environment • Highly reflective roofs can reduce urban temperatures in the summer…. • Reducing ozone formation • Reducing energy costs • Reducing fossil fuel demand
Cool Roofing…Cutting Through the Glare Cool Roofs & the Environment • ….. but the cooling effect of highly reflective roofs may be overstated • Wind effects not always considered • Degradation due to roof aging not fully addressed • Alternative approaches not always considered
Cool Roofing…Cutting Through the Glare Cool Roofs & Wind Effects The Effects of Wind on Roof Surface Air Temperature No Wind With Wind Effect Added 31 29 27 25 23 Air Temperature (oC) 0 10% 20% 30% 40% 50% 60% 70% 80% Roof Reflectivity (%) Summertime Daily Average and Maximum Air Temperatures for Roof System Reflectivity Simulations Conducted for City of Chicago Source: Study on roof system reflectivity and near-surface air temperatures in Chicago, IL (DuPuis & Graham)
Cool Roofing…Cutting Through the Glare Cool Roofs & Surface Aging Roof Reflectance After Field Exposure Oak Ridge Laboratories Envelope Systems Research Apparatus (ESRA) White membranes Highly-Reflective (50%) Reflectivity (%) Grey, tan, mineral surfaced, and ballasted membranes Semi-Reflective (20%) Black membranes Low-Reflective (5%) Exposure (Years)
Cool Roofing…Cutting Through the Glare Cool Roofs & Surface Aging Houston Chronicle, May 26, 2003 Astros cry foul over park roof Claim filed over ugly growth The roof of Minute Maid Park is growing like a Chia Pet Professional Roofing, May, 2005 Roofing’s Dirty Secret A Roof Consultant Takes The Industry To Task for Dirty Roofs
Cool Roofing…Cutting Through the Glare Cool Roofs: Design Options • Reflective Membranes • Reflective Coatings • Garden Roofs • Ballasted Roofs
Cool Roofing…Cutting Through the Glare Design Issues • Durability • Maintenance • Glare
Cool Roofing…Cutting Through the Glare Economic Issues • What does it mean for the building owner? • Scaling down the economics to the individual owner of a specific building • Are there regional differences? • Warm versus cold regions • Sunny versus cloudy regions • Regional fuel cost differences • What about operating costs? • Cleaning costs • Reflectivity versus insulation
The Economics of Cool Roofing: A Local and Regional Approach James L. Hoff
The Economics of Cool Roofing Cool Roofing & The Building Owner What are the economics of cool roofing…… 1) For an individual building owner 2) In a specific location
The Economics of Cool Roofing Potential Misunderstandings • Measurement Scale • Regional Differences
The Economics of Cool Roofing How Scale May Affect Perception Potential net annual energy savings using reflective roofs City Of Chicago: $10 Million Source: Lawrence Berkeley National Laboratory Heat Island Group
The Economics of Cool Roofing How Scale May Affect Perception Potential net annual energy savings using reflective roofs A 20,000 Sq. Ft. Building in Chicago $20 Source: DOE Cool Roof Calculator
The Economics of Cool Roofing Regional Differences • Climate • Energy Costs
The Economics of Cool Roofing Climatic Differences U.S. Low* 141 (Miami) 69 (San Francisco) 1061 (Seattle) U.S. High* 7521 (Milwaukee) 4127 (Miami) 1839 (Phoenix) Variance 5234% 5881% 73% Climate Metric Heating Degree Days Cooling Degree Days Solar Load (BTU/ Sq. Ft. / Day) * For Standard Metropolitan Statistical Areas Source: DOE Cool Roof Calculator
The Economics of Cool Roofing Energy Cost Differences U.S. Low* $0.0558 (Louisville) $0.0724 (Salt Lake City) U.S. High* $0.1236 (New York City) $1.2500 (Atlanta) Variance 122% 73% Energy Source Electricity ($ / KWH) Natural Gas ($ / Therm) * For Standard Metropolitan Statistical Areas Source: Energy Information Administration, June, 2004
The Economics of Cool Roofing Study Objectives • Adjust the scale to fit the end-user • Compare local differences in climate & energy cost • Develop a simple, but informative graphic representation
The Economics of Cool Roofing Methodology • Local Climate Inputs • Local Energy Costs • Regional Locations • Building Parameters
The Economics of Cool Roofing Local Climate Inputs • DOE Cool Roof Calculator • Heating Degree Days • Cooling Degree Days • Solar Load
The Economics of Cool Roofing Local Energy Costs • Electricity • EIA commercial electricity costs by state (June, 2004) • Natural Gas • EIA commercial natural gas costs by state (June, 2004)
The Economics of Cool Roofing Regional Locations Seattle Portland Portland Minneapolis Boise San Francisco Boston Detroit Cheyenne Milwaukee Pittsburgh Reno 40 Major Cities Across United States Chicago New York Cleveland Boulder SLC Baltimore Indianapolis Kansas City Richmond Louisville Las Vegas St. Louis Los Angeles Charlotte Nashville Little Rock Ok. City Phoenix Atlanta Albuquerque Birmingham Jacksonville Ft. Worth Tampa New Orleans Houston Miami
The Economics of Cool Roofing Building Parameters 5% Reflectance 80% Emittance Elec. Cooling (COP = 2.0) Gas Heat (70% Efficiency) 55% Reflectance 80% Emittance Elec. Cooling (COP = 2.0) Gas Heat (70% Efficiency) v. 20,000 Sq. Ft. 20,000 Sq. Ft. R-20 Insulation R-20 Insulation
Annual Heating / Cooling Cost Savings: Reflective Roof versus Non-Reflective Roof (-$100) Seattle Portland (-$50) Portland Minneapolis $0 Boise $100 San Francisco Boston Detroit Cheyenne Milwaukee $200 Pittsburgh Reno (-$50) Chicago New York Cleveland Boulder SLC Baltimore $0 Indianapolis Kansas City $100 Richmond Louisville $200 Las Vegas St. Louis Los Angeles Charlotte Nashville Little Rock Ok. City $300 $300 Phoenix Atlanta Albuquerque $400 Birmingham $500 $400 Jacksonville Ft. Worth $500 Tampa New Orleans Houston Miami (Dollars per 20,000 Sq. Ft. Roof Area / R-20 Insulation)
Annual Heating / Cooling Cost Savings: Solar Load Effects Seattle Portland Portland Minneapolis Boise San Francisco Boston Detroit Cheyenne Milwaukee Pittsburgh Reno Chicago New York Cleveland Boulder SLC Baltimore Indianapolis Kansas City Richmond Louisville Las Vegas St. Louis Los Angeles Charlotte Nashville Little Rock Ok. City Phoenix Atlanta Albuquerque Birmingham Jacksonville Ft. Worth Tampa New Orleans Houston High Solar Loads Push Bands Northward Miami
Annual Heating / Cooling Cost Savings: Solar Load Effects Low Solar Loads Push Bands Southward Seattle Portland Portland Minneapolis Boise San Francisco Boston Detroit Cheyenne Milwaukee Pittsburgh Reno Chicago New York Cleveland Boulder SLC Baltimore Indianapolis Kansas City Richmond Louisville Las Vegas St. Louis Los Angeles Charlotte Nashville Little Rock Ok. City Phoenix Atlanta Albuquerque Birmingham Jacksonville Ft. Worth Tampa New Orleans Houston Miami
The Economics of Cool Roofing Local Energy Price Effects New York City 5090 1002 $0.1236 $360 Salt Lake City 5636 1054 $0.666 $160 Metric Heating Degree Days Cooling Degree Days Electricity ($/KWH) Annual Savings
The Economics of Cool Roofing Local Energy Price Effects Baltimore 4912 1133 $0.0947 $280 Richmond 4097 1297 $0.585 $160 Metric Heating Degree Days Cooling Degree Days Electricity ($/KWH) Annual Savings
The Economics of Cool Roofing Reflectivity Effects Annual Savings (Loss) 55% Reflectivity (-$100) $0 $60 $260 $860 75% Reflectivity (-$160) -($20) $60 $340 $1,160 Change (-60%) n/a n/c 30% 35% City Seattle Detroit Indianapolis Charlotte Phoenix
The Economics of Cool Roofing Study Limitations • Demand Charges • Non-Air-Conditioned Buildings • Calculator Accuracy / Validity
(-$100) Seattle Portland Portland (-$50) Minneapolis Boise $0 San Francisco Boston Detroit Cheyenne $100 Milwaukee Pittsburgh Reno $200 (-$50) Chicago New York Cleveland Boulder SLC Baltimore $0 Indianapolis Kansas City $100 Richmond Louisville Las Vegas St. Louis $200 Los Angeles Charlotte Nashville Little Rock Ok. City $300 Phoenix Atlanta Albuquerque $300 $400 Birmingham Jacksonville $500 $400 Ft. Worth $500 Tampa New Orleans Houston Miami The Economics of Cool Roofing Reflective Roofs & The Building Owner Where will the economic payoff stimulate investment?