Download
1 / 1
10 likes | 107 Views
Parameter. Estimate. Effect. Std. Error. P value. Intercept. -3.265. -. .924. 0.000412. MMSE. 0.120. VaD. .0166. 5.22e-13. Sex. 0.604. VaD. .179. 0.000739. Age. -1.128e-05. -. 3.027e-5. 0.710. AVHAT. -0.608. AD. .101. 1.72e-09. DHAT. 0.353. VaD. .157.

E N D
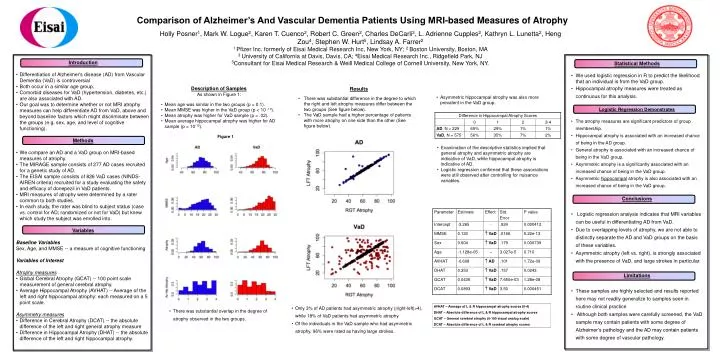
Parameter Estimate Effect Std. Error P value Intercept -3.265 - .924 0.000412 MMSE 0.120 VaD .0166 5.22e-13 Sex 0.604 VaD .179 0.000739 Age -1.128e-05 - 3.027e-5 0.710 AVHAT -0.608 AD .101 1.72e-09 DHAT 0.353 VaD .157 0.0243 GCAT 0.0435 VaD 7.650e-03 1.28e-08 DCAT 0.0893 VaD 3.50 0.000451 Difference in Hippocampal Atrophy Scores 0 1 2 3-4 AD, N = 229 69% 29% 1% 1% VaD, N = 575 56% 35% 7% 2% Comparison of Alzheimer’s And Vascular Dementia Patients Using MRI-based Measures of Atrophy Holly Posner1, Mark W. Logue2, Karen T. Cuenco2, Robert C. Green2, Charles DeCarli3, L. Adrienne Cupples2, Kathryn L. Lunetta2, Heng Zou4, Stephen W. Hurt5, Lindsay A. Farrer2 1 Pfizer Inc. formerly of Eisai Medical Research Inc, New York, NY; 2 Boston University, Boston, MA 3 University of California at Davis, Davis, CA; 4Eisai Medical Research Inc., Ridgefield Park, NJ 5Consultant for Eisai Medical Research & Weill Medical College of Cornell University, New York, NY. Introduction • Differentiation of Alzheimer's disease (AD) from Vascular Dementia (VaD) is controversial • Both occur in a similar age group. • Comorbid diseases for VaD (hypertension, diabetes, etc.) are also associated with AD. • Our goal was to determine whether or not MRI atrophy measures can help differentiate AD from VaD, above and beyond baseline factors which might discriminate between the groups (e.g. sex, age, and level of cognitive functioning). Methods • We compare an AD and a VaD group on MRI-based measures of atrophy. • The MIRAGE sample consists of 277 AD cases recruited for a genetic study of AD. • The EISAI sample consists of 826 VaD cases (NINDS-AIREN criteria) recruited for a study evaluating the safety and efficacy of donepezil in VaD patients. • MRI measures of atrophy were determined by a rater common to both studies. • In each study, the rater was blind to subject status (case vs. control for AD; randomized or not for VaD) but knew which study the subject was enrolled into. Variables Baseline Variables Sex, Age, and MMSE -- a measure of cognitive functioning Variables of Interest Atrophy measures • Global Cerebral Atrophy (GCAT) -- 100 point scale measurement of general cerebral atrophy. • Average Hippocampal Atrophy (AVHAT) -- Average of the left and right hippocampal atrophy: each measured on a 5 point scale. Asymmetry measures • Difference in Cerebral Atrophy (DCAT) -- the absolute difference of the left and right general atrophy measure • Difference in Hippocampal Atrophy (DHAT) -- the absolute difference of the left and right hippocampal atrophy. Statistical Methods • We used logistic regression in R to predict the likelihood that an individual is from the VaD group. • Hippocampal atrophy measures were treated as continuous for this analysis. Logistic Regression Demonstrates • The atrophy measures are significant predictors of group membership. • Hippocampal atrophy is associated with an increased chance of being in the AD group. • General atrophy is associated with an increased chance of being in the VaD group. • Asymmetric atrophy is a significantly associated with an increased chance of being in the VaD group. • Asymmetric hippocampal atrophy is also associated with an increased chance of being in the VaD group. Conclusions • Logistic regression analysis indicates that MRI variables can be useful in differentiating AD from VaD. • Due to overlapping levels of atrophy, we are not able to distinctly separate the AD and VaD groups on the basis of these variables. • Asymmetric atrophy (left vs. right), is strongly associated with the presence of VaD, and large strokes in particular. Limitations • These samples are highly selected and results reported here may not readily generalize to samples seen in routine clinical practice • Although both samples were carefully screened, the VaD sample may contain patients with some degree of Alzheimer’s pathology and the AD may contain patients with some degree of vascular pathology. Description of Samples Results As shown in Figure 1: • Mean age was similar in the two groups (p = 0.1). • Mean MMSE was higher in the VaD group (p < 10 -10). • Mean atrophy was higher for VaD sample (p = .02). • Mean average hippocampal atrophy was higher for AD sample (p < 10-10). Asymmetric hippocampal atrophy was also more prevalent in the VaD group. There was substantial difference in the degree to which the right and left atrophy measures differ between the two groups (See figure below). The VaD sample had a higher percentage of patients with more atrophy on one side than the other (See figure below). Figure 1 Examination of the descriptive statistics implied that general atrophy and asymmetric atrophy are indicative of VaD, while hippocampal atrophy is indicative of AD. Logistic regression confirmed that these associations were still observed after controlling for nuisance variables. Only 3% of AD patients had asymmetric atrophy (|right-left|>4), while 18% of VaD patients had asymmetric atrophy Of the individuals in the VaD sample who had asymmetric atrophy, 96% were rated as having large strokes. AVHAT – Average of L & R hippocampal atrophy scores (0-4) DHAT – Absolute difference of L & R hippocampal atrophy scores GCAT – General cerebral atrophy (0-100 visual analog scale) DCAT – Absolute difference of L & R cerebral atrophy scores There was substantial overlap in the degree of atrophy observed in the two groups.