Download

1 / 15
250 likes | 611 Views
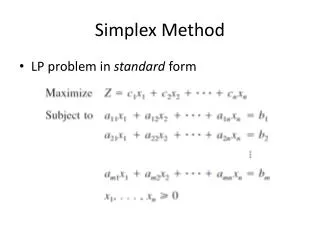
The Simplex Method. Pivoting, an Animation. Assume the Following Initial Basic Feasible Tableau for a Maximization Problem. Use the down pointer key to move forward in the animation and the up pointer key to backtrack. Step 1. Identify the Entering Variable.

E N D
The Simplex Method Pivoting, an Animation FOMGT 353 Introduction to Management Science
Assume the Following Initial Basic Feasible Tableau for a Maximization Problem. • Use the down pointer key to move forward in the animation and the up pointer key to backtrack. FOMGT 353 Introduction to Management Science
Step 1. Identify the Entering Variable. • Step 1, What is the Entering Variable? • So, x2 is the Entering Variable as 20 is the most +ve (Cj-Zj) value! The x2 Column is the “Pivot Column” for this Pivot! • Rule 1, In a Maximization, the Entering Variable is the one with the most +ve (Cj-Zj) value! FOMGT 353 Introduction to Management Science
Step 2. Identify the Leaving Variable. • Step 2, What is the Leaving Variable? • Top row B1 = 200. Value in the pivot column is 2, so the Ratio Test value is 200/2 or 100. • Rule 2, the Leaving Variable is the one with the least +ve Ratio Test result! • Take the Bi value in each row and divide it by the value in the row in the Pivot Column. • So, the minimum Ratio Test value is 100 and S1 is the Leaving Variable. • Bottom row B3 = 180. Value in the pivot column is 0.6, so the Ratio Test value is 180/0.6 or 300. • Middle row B2 = 72. Value in the pivot column is 0.6, so the Ratio Test value is 72/0.6 or 120. FOMGT 353 Introduction to Management Science
Naming of Parts • The x2 Column is the “Pivot Column”, the S1 Row is the “Pivot Row” and the orange box is the “Pivot Element”. FOMGT 353 Introduction to Management Science
The Pivot Row • We need the Pivot Row to have a 1 in the Pivot Column. • To achieve this we will divide all the values in the Pivot Row (except the Cj on the left)! by the value in the Pivot Element. FOMGT 353 Introduction to Management Science
The Second Row • We need the Second Row to have a 0 in the Pivot Column. FOMGT 353 Introduction to Management Science
The Second Row • Multiply the Pivot Row (somewhere off the Tableau!!) by the value in the Pivot Column and Row 2. • AND then subtract the result from row 2. FOMGT 353 Introduction to Management Science
The Third Row • We need the Third Row to have a 0 in the Pivot Column. FOMGT 353 Introduction to Management Science
The Third Row • Multiply the Pivot Row (somewhere off the Tableau!!) by the value in the Pivot Column and Row 3. • AND then subtract the result from row 3. FOMGT 353 Introduction to Management Science
Resetting and Recalculating • Replace S1 with x2. Update the Cj col. • Calculate the Zj row. And the Cj-Zj. FOMGT 353 Introduction to Management Science
The New Entering and Leaving Variables • x1’s (Cj-Zj) value is the largest +ve value so x1 is the Entering Variable and s2 is the leaving variable because its Ratio Test value is the min +ve value. FOMGT 353 Introduction to Management Science
Running The Next Pivot Should Get You to Here!! • The optimal solution is x1 = 63.158, x2 = 77.895, s3 = 38.526, s2 = 0, s1 = 0 and Z = 2,189.5. FOMGT 353 Introduction to Management Science
Pivoting In a Minimization • The only difference is in the choice of the Entering Variable, which involves selecting the variable with the most negative (Cj-Zj) value! • In all other ways the procedure is the same. FOMGT 353 Introduction to Management Science
The End Use the ESC key to exit! FOMGT 353 Introduction to Management Science