Download
1 / 3
0 likes | 7 Views
Discover why Business Intelligence (BI) dashboards are essential for modern analytics. Learn how BullseyeEngagement's BI dashboards transform raw data into actionable insights, enabling real-time decision-making and enhanced business outcomes.

E N D
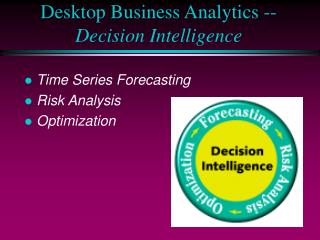
Why Business Intelligence Dashboards Are Essential for Modern Analytics In today’s fast-paced business environment, data is more than just numbers it’s a strategic asset. Organizations across all industries are leveraging data to make informed decisions, anticipate trends, and drive business outcomes. However, the sheer volume of data available can be overwhelming. This is where Business Intelligence (BI) dashboards come into play, transforming raw data into actionable insights that can be easily interpreted and utilized. BullseyeEngagement, a leader in performance management and employee engagement solutions, recognizes the pivotal role that BI dashboards play in modern analytics. By integrating these dashboards into their suite of tools, BullseyeEngagement helps organizations streamline their data management processes, making it easier to visualize, analyze, and act on data. The Evolution of Business Intelligence Business intelligence has evolved significantly over the past few decades. Initially, BI was limited to static reports that provided historical data. These reports were often complex, difficult to interpret, and could take days or weeks to produce. As technology advanced, so did the need for more dynamic, real-time insights that could be accessed and understood by a broader audience Today, BI dashboards are at the forefront of this evolution. They provide real-time, interactive visualizations that allow users to explore data from various angles. Instead of waiting for end-of- month reports, decision-makers can now access up-to-the-minute insights, enabling them to make data-driven decisions faster and with greater confidence. The Core Benefits of BI Dashboards Real-Time Data Access One of the most significant advantages of BI dashboards is the ability to access real-time data. Traditional reporting methods often involve delays due to data processing and manual compilation.
In contrast, BI dashboards update in real-time, ensuring that users always have access to the most current data. This immediacy is crucial for making timely decisions, especially in fast-moving industries where conditions can change rapidly. Enhanced Data Visualization Raw data, particularly when presented in large volumes, can be challenging to interpret. BI dashboards simplify this by transforming data into visual representations such as charts, graphs, and maps. These visualizations make complex data sets more understandable, allowing users to quickly grasp trends, patterns, and outliers. For example, a sales manager can easily track performance across different regions and adjust strategies accordingly. Improved Decision-Making By providing a clear and concise view of key metrics, BI dashboards empower decision-makers to act with greater certainty. With all relevant data presented in an easily digestible format, leaders can make informed decisions that are backed by data rather than intuition. This leads to more accurate forecasting, better resource allocation, and ultimately, improved business outcomes. Customization and Flexibility Modern business intelligence dashboards are highly customizable, allowing users to tailor the interface to meet their specific needs. Whether it’s tracking key performance indicators (KPIs), monitoring financial metrics, or analyzing customer behavior, users can create dashboards that focus on the most relevant data for their role. This customization ensures that everyone in the organization, from executives to front-line employees, has access to the information they need to succeed. Collaboration and Sharing BI dashboards also facilitate collaboration across teams and departments. By providing a single source of truth, these dashboards ensure that everyone in the organization is working with the same data. This consistency reduces the risk of miscommunication and helps teams align their efforts toward common goals. Additionally, dashboards can be easily shared with stakeholders, both internal and external, ensuring transparency and fostering a data-driven culture. The Role of BI Dashboards in Modern Analytics In the realm of modern analytics, BI dashboards serve as the bridge between data and action. As organizations collect more data than ever before, the ability to analyze and interpret this data quickly and accurately becomes a competitive advantage. BI dashboards enable this by providing a platform where data can be aggregated, analyzed, and presented in a way that is both intuitive and actionable. For instance, in the field of human resources, a BI dashboard can be used to monitor employee engagement, track performance metrics, and identify trends in workforce management. With BullseyeEngagement’s solutions, HR professionals can leverage these insights to improve employee satisfaction, reduce turnover, and enhance overall organizational performance Similarly, in sales and marketing, BI dashboards can be used to track campaign effectiveness, monitor sales pipelines, and analyze customer behavior. By having real-time access to these insights, marketing teams can adjust their strategies on the fly, optimizing campaigns for better results. Implementing BI Dashboards with BullseyeEngagement
Implementing BI dashboards in your organization doesn’t have to be a daunting task. BullseyeEngagement offers a range of customizable BI dashboards that are designed to meet the unique needs of your business. Whether you’re looking to improve performance management, enhance employee engagement, or gain deeper insights into your operations, BullseyeEngagement has the tools and expertise to help you succeed. Their BI dashboards are not only user friendly but also highly scalable, making them suitable for organizations of all sizes. With BullseyeEngagement, you can start small and expand your dashboard capabilities as your business grows. Conclusion In today’s data-driven world, the ability to quickly and accurately interpret data is crucial for success. BI dashboards are essential tools for modern analytics, offering real-time insights, enhanced data visualization, and improved decision-making capabilities. By integrating BI dashboards into your organization’s workflow, you can unlock the full potential of your data and drive better business outcomes. BullseyeEngagement understands the importance of BI dashboards and offers solutions that help organizations harness the power of their data. Whether you’re looking to improve performance management, enhance employee engagement, or make more informed decisions, their BI dashboards provide the tools you need to succeed in today’s competitive landscape. Unlock the full potential of your data with BullseyeEngagement's customizable business intelligence dashboards. Start making smarter, data-driven decisions today contact us to learn more!