Download
1 / 4
40 likes | 63 Views
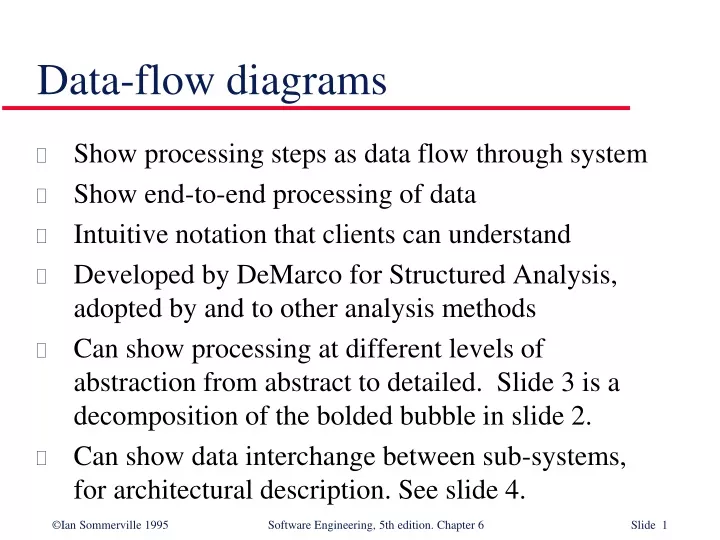
Learn how to show end-to-end data processing using intuitive notation clients can understand. Discover DeMarco's Structured Analysis method adopted by various analysis techniques for depicting processing at different levels of abstraction. Slide 3 demonstrates a decomposition of the bolded bubble in Slide 2, illustrating data interchange between subsystems. Explore equipment procurement and order placement in CASE toolset.

E N D
Data-flow diagrams • Show processing steps as data flow through system • Show end-to-end processing of data • Intuitive notation that clients can understand • Developed by DeMarco for Structured Analysis, adopted by and to other analysis methods • Can show processing at different levels of abstraction from abstract to detailed. Slide 3 is a decomposition of the bolded bubble in slide 2. • Can show data interchange between sub-systems, for architectural description. See slide 4.