Download

1 / 42
420 likes | 441 Views
Explore the factors influencing tropical cyclone occurrence and forecast parameters for hurricane intensity and landfall probability. Learn about the necessary conditions and major climatic features affecting Atlantic Basin hurricanes. Discover the seasonal forecasting strategy for predicting hurricane activity.

E N D
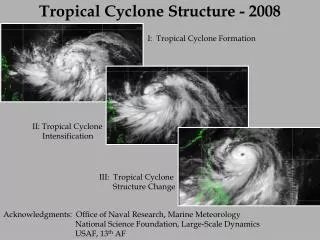
Tropical Cyclone Forecasts Dr. Richard J. Murnane Risk Prediction Initiative Bermuda Biological Station for Research, Inc.
2 1 0 Hurricane Landfall per Year 1910 1930 1950 1970 1990 Year Cat 1&2 Cat 3, 4, 5 Hurricane Landfall in Miami and Dade County Landsea, 1997
Tropical Cyclone Seasonal Forecasting Strategy • Identify predictable global and local features that drive climate • Statistically relate features to tropical cyclone occurrence
Outline • Background on tropical cyclones • Necessary conditions • Forecast parameters • Seasonal forecasts • Basin-wide • Landfall • Real-time hurricane intensity forecasts • Numerical prediction • Theoretical Maximum Potential Intensity
Necessary Conditions • Coriolis Effect • Unstable Atmosphere • Sea Surface Temperature > 26º C • Trigger • Little Vertical Wind Shear • High Relative Humidity
Major Climatic Features Affecting Atlantic Basin Hurricane Activity • El Niño-Southern Oscillation (ENSO) • Quasi-biennial Oscillation • Sea Surface Temperature (SST) • West Africa Rainfall • Atmospheric Zonal Wind Anomalies • Sea Level Atmospheric Pressure
Normal El Niño El Niño-Southern Oscillation Images from IRI web site
0.8 El Niño 0.6 Neutral El Viejo Probability 0.4 0.2 0.0 0 2 4 6 8 Number Landfalls Per Year US Hurricane Landfalls ³Cat. 3 J. O’Brien & COAPS
El Niño Neutral El Viejo Baroclinically InfluencedAtlantic Storms: Hurricane Landfalls/year 1.0 0.8 0.6 # Landfalls/year 0.4 0.2 0.0 Cat 1 Cat 2 Cat 3
El Niño Neutral El Viejo Tropical Only Atlantic Storms: Hurricane Landfalls/year 1.5 1.0 # Landfalls/year 0.5 0.0 Cat 1 Cat 2 Cat 3
East Phase West Phase SuppressedAtlantic Hurricane Formation Enhanced Atlantic Hurricane Formation Quasi-Biennial Oscillation (QBO) Arrows show stratospheric wind direction
Sea Surface Temperature Climate Prediction Center
Sea Surface Temperature Anomalies Climate Prediction Center
200 100 0 Oct Dec July Nov May Aug June Sept Jan-Apr Seasonal Atlantic Hurricane Activity (1886-1991)
Western Sahel Region Gulf of Guinea Region West African Rainfall
1900 1920 1940 1960 1980 Sahel Rain (1899 – 1990) 2 1 0 -1 -2 Standard Deviation Year Landsea et al., 1992
14.43 IHD Intense Hurricanes vs. Sahel Rain 1949 – 1990 0.64 IHD 7 Driest Sahel Years 7 Wettest Sahel Years Gray & Landsea, 1992
N. Atlantic SST Anomaly NE Atlantic SLP Anomaly (neg) Sahel Rain Intense Hurricane Days Long-term Trends 2 1 0 -1 -2 Standard Deviation 1950 1960 1970 1980 1990 Year Gray, 1998
Gray et al.’s Basin-wide Forecasts • Issued in: December, April, June, August • Forecast includes a variety of parameters: • Named Storms • Hurricanes, Hurricane Days • Intense Hurricanes, Intense Hurricane Days • Hurricane Destruction Potential • Net Tropical Cyclone Activity • Predictive Parameters Vary With Forecast
Elsner’s Atlantic Basin Forecasts • Uses subset of Gray variables • Zonal winds • West African rainfall • Divides storms into tropical only and baroclinically influenced • assumes climatology for baroclinically influenced storms (» 3 per year) • Predicts tropical only storms using OLS • Calculates intense hurricanes using Poisson regression
Elsner et al. Forecast 1998 Atlantic Intense Hurricanes 0 1 2 3 4 5 6£ Elsner et al., 1998
Gray Landfall Forecast • Divides coast into separate sections • Uses Atlantic Basin seasonal forecast of “Net Tropical Cyclone Activity” (NTC) and SST anomalies to calculate total landfall probability • Distributes total probability along coast based on landfall climatology
Cat 1&2 Hurricane Landfalls Gray, 1998
Intense Hurricane Landfalls Gray, 1998
1998 Landfall % Probability Forecast » 4 » 5 » 7 33 » 6 » 8 39 36 8 10.2 34 Gray, 1998
Elsner Landfall Probability Forecasts • Uses “Logistic Regression” for predictions • Predictors include: • Zonal wind anomalies • Sea level pressures • QBO • West African rainfall
1998 Location Forecast Elsner et al., 1998
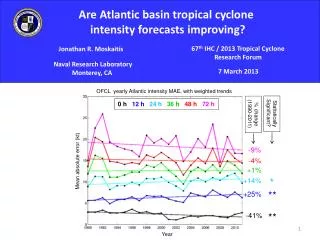
NHC Intensity Forecasts (1990-97) 25 20 15 10 5 72 hours 48 hours Error (knots) 24 hours 1994 1993 1990 1991 1992 1995 1996 1997 Year Avila, 1998
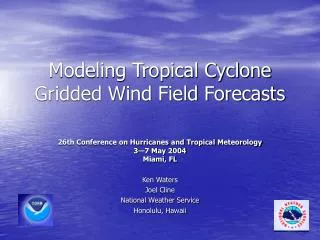
Ginis et al.’s Hurricane Forecasts • Based on Coupled Ocean-Atmosphere Model • Full Ocean Model Reproduces Air-Sea Interactions and Improves Intensity Forecasts
Hurricane Opal Ginis, 1998
Maximum Potential Intensity (MPI) • Developed by Emanuel and Bister • MPI Controlled by Environmental Factors, e.g.: • Sea Surface Temperature • Upper Atmosphere Temperature • Relative Humidity • Doesn’t account for forward motion
-100 -75 -50 -25 Upper Atmosphere Temperature (ºC) 15 20 25 30 35 40 45 Sea Surface Temperature (ºC) Contours of Maximum Wind Speed (m/s) Emanuel and Bister, 1998
Maximum Potential Winds (m/s) Emanuel and Bister, 1998
Maximum Potential Wind (knots) Emanuel and Bister, 1998
Conclusions • Many of the seasonal forecast parameters are related to the necessary conditions for tropical cyclone formation • Basin-wide seasonal forecasts are easier to make than landfall forecasts but they are of less relevance • Realistic representations of the ocean are needed to improve tropical cyclone intensity forecasts