Download
1 / 9
110 likes | 330 Views
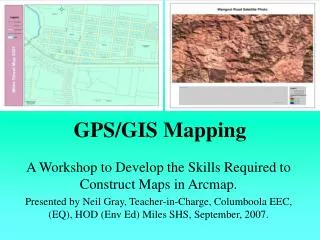
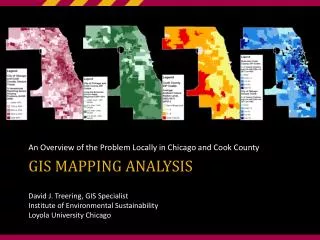
GIS Mapping. Emily McBride Sarah Nguyen. What is GIS. G eographic I nformation S ystems System capable of capturing, storing, analyzing, and displaying geographical data identified according to location

E N D
GIS Mapping Emily McBride Sarah Nguyen
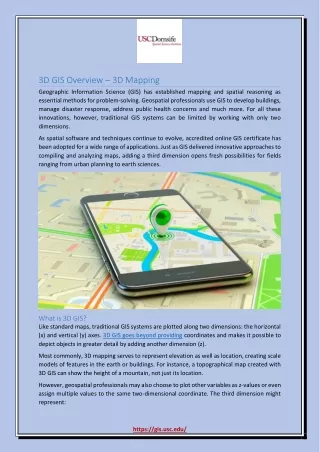
What is GIS • Geographic Information Systems • System capable of capturing, storing, analyzing, and displaying geographical data identified according to location • Uses include: Topological modeling, simulating environmental effects, graphical display, climate history
How GIS Works • Reference system using latitude and longitude (spatial data) to pin point global locations • Envision the geographic aspects of a body of data • Converts data points into 3D image map consisting of layers that show elevation and land form http://ci.ftlaud.fl.us/GIS/images/learn2.gif
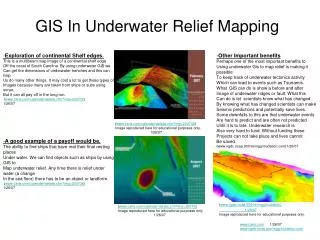
GIS Samples Map of lava flows along Mauna Loa's northeast rift zone Cat Mountain in Arizona http://erg.usgs.gov/isb/pubs/gis_poster/ http://hvo.wr.usgs.gov/volunteer/gis/maunaloa-gis_large.jpg
Relationship to Data Structures • Uses grid/graph data structures to store data • Network represented by adjacency matrix where rows and columns are location nodes • Arc relationship represented on table • Data is displayed in graphical form http://www.npwrc.usgs.gov/resource/habitat/research/struct.htm
Familiar Algorithms • Shortest path: • The labeling method employs a scanning operation to scan each node recursively until all nodes on a network are scanned onto the map • Time complexity O(N2) http://www.osa-jon.org/images_issues/jon-3-11.gif
Familiar Algorithms Cont’d • Adjacency lists used to show relationship between location nodes on graph • Time complexity O(N2) • N = number of nodes used in graph • “Divide and Conquer” • Nodes are divided into smaller and small groups • Intersection tests used to determine relationship between two nodes on graph
Conclusion • GIS technology utilizes adjacency matrices and lists to create topological maps • Data points are nodes showing true land features • End result is conversion of data points into 3D image http://www.sgi.com/fun/gallery/images/gis.jpg
References Images • http://erg.usgs.gov/isb/pubs/gis_poster/ • http://ci.ftlaud.fl.us/GIS/images/learn2.gif • http://hvo.wr.usgs.gov/volunteer/gis/maunaloa-gis_large.jpg • http://www.osa-jon.org/images_issues/jon-3-11.gif • http://www.sgi.com/fun/gallery/images/gis.jpg Information • http://erg.usgs.gov/isb/pubs/gis_poster/ • http://www.rac.louisiana.edu/education_tools/gis.html • http://www.ncgia.ucsb.edu/giscc/units/u064/u064.html • http://www.coloradocollege.edu/dept/SW/GIS_Lab/tips&tricks/Understanding_Topology.doc • http://www.npwrc.usgs.gov/resource/habitat/research/struct.htm