Download
1 / 87
880 likes | 1.12k Views
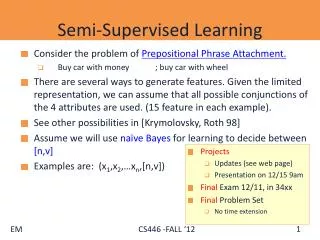
Nan Song Advisors: John Lafferty, Dannie Durand. Gene family classification using a semi-supervised learning method. Outline. Introduction A motivating application: genome annotation A graphical model of sequence relatedness Gene classification using machine learning

E N D
Nan Song Advisors: John Lafferty, Dannie Durand Gene family classification using a semi-supervised learning method
Outline • Introduction • A motivating application: genome annotation • A graphical model of sequence relatedness • Gene classification using machine learning • Empirical evaluation • Conclusion
The Genome The complete genetic material of an organism or species
Key genomic component: genes A gene is a DNA subsequence ACCCTTAGCTAGACCTTTAGGAGG...
A gene is a DNA subsequence ACCCTTAGCTAGACCTTTAGGAGG... A protein is an amino acid sequence A protein is an amino acid sequence VHLT P E... Genes encode proteins, the building blocks of the cell Key genomic component: genes A gene is a DNA subsequence Genes encode proteins, the building blocks of the cell ACCCTTAGCTAGACCTTTAGGAGG... VHLT P E...
Whole Genome Sequencing 413 whole genome sequences: 41 eukarya, 28 archaea, 344 bacteria In progress: 1034 prokaryotic genomes, 629 eukaryotic genomes www.genomesonline.org
14,882 Known genes 16,896 Predicted genes 31,778 Total Gene prediction and annotation International Human Genome Consortium, Nature 2001
Gene annotation • We are given a new genome sequence with predicted genes. • A few genes are well studied. • Identify other genes in the same family to predict function. • Verify predictions experimentally Two contexts: • Individual scientist • High throughput
Outline • Introduction • Molecular biology • A motivating application: genome annotation • A graphical model of sequence relatedness • Gene classification using machine learning • Empirical evaluation • Conclusion
atgcgccgtctggcatgt… atgcgaggtctcccatgt… atgcaaggagtcccagagc… γ-globin β-globin ε-globin Evolutionarily related genes have related functions Ancestral gene atgccaggactcccagtga… Duplication Duplication Adult Fetal Embryonic
Evolutionarily related genes have related functions Ancestral gene Gene family classification is a powerful source of information for inferring evolutionary, functional and structural properties of genes atgccaggactcccagtga… Duplication Duplication atgcgccgtctggcatgt… atgcaaggagtcccagagc… atgcgaggtctcccatgt… β-globin γ-globin ε-globin
Outline • Introduction • A graphical model of sequence relatedness • Gene classification using machine learning • Empirical evaluation • Conclusion
A graphical model of sequence relatedness • G = (V,E) • V: represent sequences • E: weight of the edge is proportional to the similarity between sequences. …atgcaaggagtcccagagcc… …atgcgaggtctcccagtgtc… xi xj
A graphical model of sequence relatedness • G = (V,E) • V: represent sequences • E: weight of the edge is proportional to the similarity between sequences. xi xj
Gene family classification • Biological scenario: • small number of known genes • large number of unknown genes Goal: Given known genes, identify genes in the same family. xi xj
Outline • Introduction • A graphical model of sequence relatedness • Gene classification using machine learning • Empirical evaluation • Conclusion
Framework: binary classification • Machine learning scenario: • small number of labeled data • genes known to be in family • genes clearly not in family • large number of unlabeled data Determine which unlabeled genes belong to the family.
Mutations DNA shuffling atgcgccccccggcatgt… atgcgccgtctggcatgt…ggctcgta Several challenging problems of gene family classification Ancestral gene Duplication Duplication atgcgccgtctggcatgt… atgcgaggtctcccatgt… atgcaaggagtcccagagc… Traditionally, similarity is represented by sequence comparison
Mutations DNA shuffling atgcgccccccggcatgt… atgcgccgtctggcatgt…ggctcgta Several challenging problems of gene family classification Ancestral gene Duplication Duplication atgcgccgtctggcatgt… atgcgaggtctcccatgt… atgcaaggagtcccagagc… Traditionally, similarity is represented by sequence comparison
Several challenging problems of gene family classification Families • do not form a clique • do not form a connected component • have edges to sequences outside the family.
Outline • Introduction • A graphical model of sequence relatedness • Gene classification using machine learning • Semi-supervised learning algorithm • Supervised learning algorithm • Empirical evaluation • Conclusion
Gene family classification • Machine learning scenario: • large number of unlabeled data • small number of labeled data Goal: Binary classification • Semi supervised learning: • Exploit information from both labeled and unlabeled data • Performed well in many applications
Graphical semi-supervised learning (Binary classification) (xj,yj = 0) (xk,f(k)) • Notation: • V: The whole data set • L: Labeled data set • U: unlabeled data set • Each vertex: (xi,yi) or (xk, f(k)) (xi,yi = 1) Xiaojin Zhu, Zoubin Ghahramani, John Lafferty The Twentieth International Conference on Machine Learning (ICML-2003)
Graphical semi-supervised learning (Binary classification) (xj,yj = 0) • Input: • family members (xi,yi = 1) • nonfamily members: (xj, yj = 0) (xk,f(k)) • Output: • Assign a real value to every vertex in the graph • Find a cutoff to separate the two classes (xi,yi = 1) Xiaojin Zhu, Zoubin Ghahramani, John Lafferty The Twentieth International Conference on Machine Learning (ICML-2003)
Graphical semi-supervised learning (Binary classification) Assign real values to all vertices in the graph, to minimize E(f): (xn,yp = 1) (xk,f(k)) Sij (xi,yi = 0) G = (V,E) L: Labeled data set U: unlabeled data set
Graph-based semi-supervised learning f(xk) Works well http://www.cs.wisc.edu/~jerryzhu/research/ssl/animation.html
Graph-based semi-supervised learning f(xk) Works well Works well ? http://www.cs.wisc.edu/~jerryzhu/research/ssl/animation.html
Outline • Introduction • A graphical model of sequence relatedness • Gene classification using machine learning • Semi-supervised learning • Supervised learning • Empirical evaluation • Conclusion
Semi-supervised vs kernel-based supervised learning • Semi-supervised learning: • Supervised learning: where L is the labeled data set and U is the unlabeled data set
Outline • Introduction • A graphical model of sequence relatedness • Gene classification using machine learning • Empirical evaluation • Methodology • Results • Conclusion
Graph construction • G = (V,E) • V: All mouse sequences from SwissProt (n = 7439) • E: based on newly designed sequence similarity measurement. • 0 < S(i, j) < 1
Methodology • Graph construction • Test set construction • Experiments performed • Basis for evaluation
ACSL FOX Laminin SEMA USP ADAM GATA Myosin T-box WNT DVL Kinase Notch TNFR FGF Kinesin PDE TRAF Test set construction 18 well studied protein families • Receptors, enzymes, transcription factors, motor proteins, structural proteins, and extracellular matrix proteins.
Test set construction • Retrieved all complete mouse sequences from SwissProtdatabase (7,439) • Identified sequences for each test family based on • Nomenclature committee reports • Structural properties • Literature surveys
Methodology • Graph construction • Test set construction • Experiments performed • Basis for evaluation
Experiments performed • Compare semi-supervised with supervised learning algorithm • Tested parameters: • Scaling parameter,σ, in the kernel function • Number of Labeled Family members (LF) • Number of Labeled Nonfamily members(LN)
σ number of Labeled Family members number of Non-labeled Family members Tested parameters For each set of parameters, 20 tests were performed
σ=100 1 σ=10 0.8 W 0.6 σ=1 0.4 σ=0.5 0.2 0.08 σ=0.2 0.05 σ=0.1 0.02 0 0 0.2 0.4 0.6 0.8 1 S Tested parameters (1) Tested σ values: 0.05, 0.1, 0.5, 1, 2, 10, 100
Tested parameters (2) • Labeled Family members (LF): 10-70% of family size • Labeled Nonfamily members (LN) : 100, 500, 1000 about 1 - 10% of nonfamily size Database size: 7439
Methodology • Graph construction • Test set construction • Experiments performed • Basis for evaluation
Semi-supervised learning Goal: f(i) > f(j) when xi is a family member and xj is not. Evaluation criteria: • Visualization • AUC score • False negatives
Sort all unlabeled data by f(x) Family members f(x) Nonfamily members Rank Visualization
Family members f(x) Nonfamily members sensitivity Rank 1 - specificity Rank plot AUC (Area Under ROC Curve)
Advantages of rank plot AUC = 0.9382
AUC scores do not reflect all information we need • False negatives after the first false positive • The number of missed data after the first false positive
Outline • Introduction • A graphical model of sequence relatedness • Gene classification using machine learning • Empirical evaluation • Methodology • Results • Conclusion
Several challenging problems of gene family classification Families • do not form a clique • do not form a connected component • have edges to sequences outside the family. Edges to sequences outside the family are mainly a problem if they have strong edge weights
Test families have different graph properties W: Edges to sequences outside the family have weak edge weights S: Edges to sequences outside the family have strong edge weights
Results • Compare semi-supervised with supervised learning algorithm • Tested parameters: • Scaling parameter,σ, in the kernel function • Number of Labeled Family members (LF) • Number of Labeled Nonfamily members(LN)