Download
1 / 21
210 likes | 331 Views
The DØ Silicon Microstrip Tracker (SMT). Design Production & Assembly Readout Installation & Commissioning First Results. Breese Quinn, FNAL Vertex2001 September 24, 2001 (presented by Frank Lehner, Universitaet Zuerich). SMT Design. 12 F Disks. 4-layer barrel cross-section.

E N D
The DØ Silicon Microstrip Tracker (SMT) • Design • Production & Assembly • Readout • Installation & Commissioning • First Results Breese Quinn, FNAL Vertex2001 September 24, 2001 (presented by Frank Lehner, Universitaet Zuerich)
SMT Design 12 F Disks 4-layer barrel cross-section 4 H Disks 6 Barrels SMT Statistics B. Quinn
SMT Design B. Quinn
SMT Design • Require good 3D track reconstruction performance for high-pT (top, Higgs, EW, NP) and low-pT (B) tracks out to || < 3 • Momentum resolution less than 10% at pT = 1 GeV/c • Impact parameter resolution within 30 m • Forward H disks are employed to achieve these resolutions at high || B. Quinn
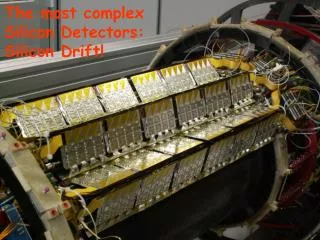
Production & Assembly: Devices • Ladders • 3-chip: 72 single-sided, axial ladders in the two outer barrels • 6-chip: 144 double-sided, axial/90° ladders in the four inner barrels • 9-chip: 216 double-sided, axial/2° ladders in all barrels • Ladders have a mechanical accuracy of 2-5 m • Wedges • F Disks: 144 double-sided, ±15°, 6+8 chip wedges • H Disks: 96×2 back-to-back single-sided, ±7.5°, 6 chip wedges • Wedges have a mechanical accuracy of 5-10 m • SVX IIe chip • 128 channel 8-bit digital chip, with 32 cell pipeline depth • 1.2 m rad-hard technology • 106 MHz digitization, 53 MHz readout • Rise time set to integrate 99% of charge in 100 ns • Over 2.3 million wirebonds were made to chips 9-chip ladder H wedge SVX IIe chip B. Quinn
Production & Assembly: Testing • Probe Test • Debug bad strips (broken capacitors), bonds, chips, etc. • Determine the V-I characteristics of the sensors • Measure V-max p-side breakdown voltage (micro-discharge effect) • Burn-in • Bias the ladder or wedge and test the readout for 72 hours • Measure pedestals, noise, gain and check sparse readout • Laser • Expose biased detectors to a narrow laser scan • Measure the depletion voltage and leakage currents and identify dead channels • Readout tested again after the detector is mounted on a barrel or disk V-max Fail B. Quinn
Production & Assembly: Failure Modes • Sensor lithography defects • A silicon manufacturing problem produced p-stop isolation defects in the 90° stereo ladders. This resulted in a 30% yield from the manufacturer. • Microdischarge effect • With negative p-side bias on double-sided detectors, we observed microdischarges producing large leakage currents and noise at a breakdown voltage. • The effect occurs along the edges of the p implants, where large field distortions and charge accumulations result from misalignment of electrodes with implants. • Effect moves to n-side after type inversion. B. Quinn
Production & Assembly: Detector Quality • Detector classification: • Dead channel: < 40 ADC count response to laser • Noisy channel: > 6 ADC count pedestal width • Grade A: less than 2.6% dead/noisy channels • Grade B: less than 5.2% dead/noisy channels • Only used mechanically OK Grade A and B detectors 6-Chip Ladders Channel Fractions (%) B. Quinn
Production & Assembly: Alignment Barrel 1 Rotations Internal alignment was accomplished using a CMM machine that aligns ladders and wedges to < 20 m. e.g. Rotation along long axis of ladder ( = 10 m 3 m error on impact parameter) (mm) B. Quinn
SMT Readout: Data Flow HV / LV I,V,T Monitoring 8’ Low Mass Cable ~19’-30’ High Mass Cable (3M/80 conductor) 25’ High Mass Cable (3M/50 conductor) 3/6/8/9 Chip HDI KSU Interface Board CLKs CLKs Adapter Card SEQ SEQ SEQ Sensor SEQ Controller Optical Link 1Gb/s Detector volume Platform Serial Command Link VRB VRB VRB VBD 68k/PwrPC 1 5 5 3 VRB Controller Bit3 VME PC MPM L3 Counting House SDAQ B. Quinn
SMT Readout: Electronics • SEQuencers • 6 crates (120 boards) located on the detector hall platform • Use SVX control lines to effect data acquisition, digitization and readout • Convert SVX data to optical signals • VRBs (VME Readout Buffers) • 12 crates (120 boards) located in the counting house • Data buffer pending L2 trigger decision • Input @ 5-10 kHz L1 accept rate ~ 50 Mb/s/channel • Output @ 1 kHz L2 accept rate ~ 50 Mb/s • Interface Boards • 8 crates (144 boards) located inside the detector volume • Refresh signals and adjust timing • SVX monitoring and power management • Bias voltage distribution B. Quinn
Installation Fiber Tracker • Cylinder installation was completed on 12/20/00 • A ½ cylinder of 3 barrels and 6 F disks was inserted into each end of the CFT bore • H Disk installation was completed on 2/6/01 • The cabling (~15,000 connections) and electronics installation was completed in May 2001 Calorimeter Low Mass Cables SMT High Mass Cables Interface Boards B. Quinn
Commissioning • The entire detector has been connected and powered • ~15% of the devices are not in the readout because the SVX chips cannot be downloaded. • 10% ladders, 18% F wedges, 20% H wedges • Problems could be with cables, connectors, chips, etc. We will debug each of them during the October/November shutdown, and expect to recover more than half. • Currently collecting calibration and alignment data B. Quinn
Comissioning • Online event display for SMT commissioning B. Quinn
Charge Collection • A cluster is defined as a contiguous sequence of strips with • Each strip 6 ADC counts • Cluster 12 ADC counts • Timing setting a-b-c represents a signal delay of (a-1)132 ns + (b-1)18 ns + (c-1)2 ns • Preamp bandwith (pabw) sets the integration time • With 396 ns bunch spacing, all charge should be collected with any of the pabw settings • Higher pabw results in lower noise level B. Quinn
Timing and S/N • Higher preamp bandwith does not significantly reduce noise on n-side B. Quinn
Alignment: Residuals • SMT-only tracking with at least 4 hits • Magnet off data • Similarity of residuals from reconstruction with ideal and survey geometries indicates excellent internal alignment of the SMT Ideal Geometry Survey Geometry B. Quinn
Alignment: SMT & CFT Track Matching • Tracks were found separately in the SMT and the Central Fiber Tracker (CFT) • SMT tracks were extrapolated to the CFT at which point the track offsets were measured • Magnet off data r = -3 36 m B. Quinn
J/ Candidate Sample PRELIMINARY Sherry Towers B. Quinn
Conclusions • Design/Production • Experience with double-sided detectors has led to the decision to use single-sided silicon for the upgrade. • Should work toward simpler designs in the future. For example, using 6 different sensor types resulted in extensive logistical complications. • Assembly/Installation • Alignment results show that the DØ SMT was assembled and installed extremely well. Congratulations to the SiDet and DAB staff! • Commissioning • The SMT was the first major DØ Upgrade detector system fully operational for Run 2A. More than 85% of the channels were available for readout on startup, and most of the remaining channels will be debugged and recovered by November. • Results • Very nice calibration (and first look at physics!) results have been produced from the early data, as we continue to better understand our detector. B. Quinn
Alignment: Beam Distance of Closest Approach vs. Vertex Position B. Quinn