Download
1 / 32
410 likes | 802 Views
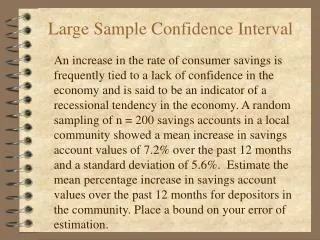
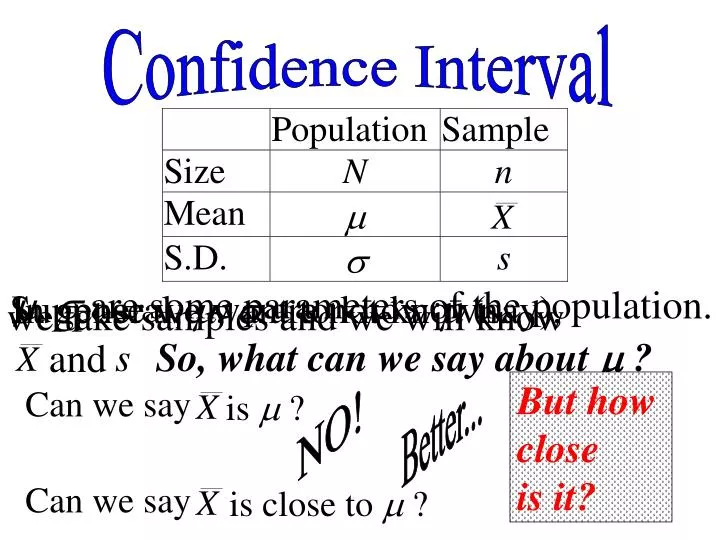
But how close is it?. Confidence Interval. , are some parameters of the population. Suppose we want to know (say),. In general, , are not known. we take samples and we will know. s. So, what can we say about ?. and. Better. Can we say. is ?. NO!. Can we say.

E N D
But how close is it? Confidence Interval , are some parameters of the population. Suppose we want to know (say), In general, , are not known. we take samples and we will know s So, what can we say about ? and Better... Can we say is ? NO! Can we say is close to ?
To estimate by a number it is too “dangerous”! It is much “safer” to estimate by an interval. we can have sample mean and variance; Based on the data from random samples, suppose by some further calculation, we can find an interval (L,U), such that P(L< < U) = 95 % (say), that means there’s 95% chance (L,U) traps. We say (L,U) is a 95%confidence interval for
But how to find (L,U)? In general, to estimate a parameter , if we can find a random interval (L,U) such that P(L < < U) = k%, (L,U) is called a k%confidence interval for In AL, you are required to constructconfidence interval C.I. for (1) population mean and (2) population proportion.
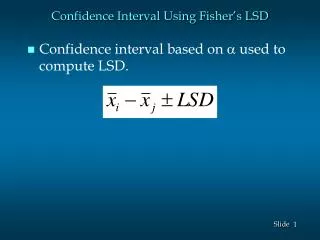
Let’s talk about C.I. for . Task: Find 95%C.I. for . By CLT, Suppose (L,U) is a 95% C.I. for , P(L < < U) = 95% --- (1) By table, P(1.96 < z < 1.96) = 95% Rearranging, 95% C.I. for is Comparing (1),
is a 95% C.I. for . Ans: How about a 99% C.I. for ? since P(2.58 < z < 2.58) = 99% In general, a % C.I. for is where P(zc < z < zc) = % %is called the confidence level.
is a % C.I. for . Note 1: zc , hence width of C.I. Reasonable! To ensure more chance to “trap” the true , we can have wider width of C.I. But it is close to meaningless to mention C.I. of large range, e.g. if we claim that we have 100% confident that the true lies on (,). Note 2: In practice, we don’t even know , then we should use sample s.d. s to replace . More precisely, use s[n/(n1)] instead of s.
E.g. 26 Masses of random sample (in g) are 182, 184, 176, 178, 181, 180, 183, 178, 179, 177, 180, 183, 179, 178, 181, 181. If this sample came from a normal population = 10g, obtain a 95% C.I. for mean mass of the population. For the sample, Hence 95% C.I. for is = (175.1, 184.9)
In previous question, (175.1,184.9) is a 95% C.I. for the true mean . Am I right in saying that there is 95% chance that lies in (175.1,184.9) ? NO! Note 1: is NOT a random variable! While, the interval (L,U) is a random interval. Note 2: Wecan just say that we are 95% confident that lies on (L,U). How to comprehend this ?
Sample 1 (L1,U1) Sample 2 (L2,U2) Sample n (Ln,Un) Population . . . . . .
X If (L1,U1), (L2,U2) , …, (Ln,Un) are 95% C.I. then there should be 95% of theses intervals (L1,U1), (L2,U2) , …, (Ln,Un) includes the true mean . For 20 95%C.I. there should be 19 C.I. trap the true mean. So (175.1,184.9) is just one of the C.I.s and it may or may not trap .
An example. Suppose {X1, X2,…, X7} = population set. We take 2-element samples. (n = 2) Total possible way = 7C2 = 21 Hence we can construct 21 different C.I.s We consider the 90% C.I. See the WORDS document now.
We know 21 C.I.s, 19 of them do trap . Please notice that 2190% 19 Also, the sample size = 2, too small! Instead of using We use the adjusted sample s.d.. Refer to P.81 note (ii) in text book.
E.g. 27 A certain population, = 6. How large a sample size => width of 95% C.I. for = 0.5 95%C.I.= Half width = 0.25 n = 2209
Someone,"the larger the sample size, the shorter the C.I. width." Do you agree?
If is known, C.I. is If is unknown, C.I. is Precisely,
E.g. 28 A sample of 100 plugs with mean diameter 25.10 cm. If s.d. of these plugs is 0.12, estimate the population mean diameter at 95% confident level. Now, we don’t know , so use sample s.d. s = (25.076,25.124)
E.g. 31 (a) A two-stage rocket to be fired to put a satellite into orbit. Due to variation of the specified impulse in the second stage, the velocity imparted in this stage will be normally distributed about 4095 ms1 with s.d. 21 ms1 Find 95% confident limits for the velocity imparted in this stage. 95% C.I. = = (4054 , 4126) =
(b) In the first stage, the velocity imparted will be normally distributed about 3990 ms1 with s.d. 20 ms1 due to variation of the specific impulse and (independently) with s.d. 8 ms1 due to variation in the time of burning of the change. Find 90% confident limits for the velocity imparted in this stage. s2 = 20, s3 = 8 Combined s.d. = = 21.54 90% C.I. = = (39901.64521.54, 3990+1.64521.54) = (3955,4025)
(c) Given that the final velocity of 8000 ms1 is required to go into orbit and that the second stage fires immediately after the first, find the probability of achieving orbit. v = 4095 s2 = 212 v1 = 3990 s12 = 202+ 82 Let V = final velocity E(V) = 3990 + 4095 = 8085 Var(V) = 202 + 82 + 212 = 905 V ~ N(8085,905) P(V > 8000) = = 0.9977
Prerequisite on E.g. 32 f(x) r x a b Uniform distribution
E.g. 32 To add 104 numbers, each of which was rounded off with accuracy 10m degree. Assuming that the errors arising mutually independent and uniformly distributed on (0.510m, 0.510m), find the limits in which the total error will lie with probability 0.99. Let X = total error. X = X1 + X2 +…+ X10000 Since Xi is uniformly distributed, = 0
= 0 By CLT, By table, P(2.56 < z < 2.56) = 0.99 Hence the limits are Hence we can construct the 99% C.I. for total error X and this estimation is far more better! Let’s use m = 3 as an example. |X| 0.0005104= 5, too large for estimation! But the C.I. is (0.0739,0.0739) only, more “precise”.
Now, let’s talk about C.I. for proportion You have interviewed with 100 H.K. people and discovered 60 smokers. Suppose you want to look into the smoker’s proportion in H.K. However, we can construct a C.I. to estimate the true proportion! NO! Can we say the smokers’ proportion of H.K. people is 60% ? HOW?
Let n be the sample size. Let m be the number of “success” (i.e. “smokers” in the e.g.) Let p be the true proportion (of “success”) Suppose the population is very large, then m has a binomial distribution such that m ~ B(n , p) Suppose further that n is reasonably large. We can use “normal” to approximate “binomial”. m ~ N(np , npq)
Let Ps be the proportion on “success” in sample. Hence Ps~ In practice, p is unknown. We use Ps Qs/n to estimate pq/n. Ps~ approximately Thus
Hence Rearranging, Hence 95% C.I. for population proportion p is
In general, % C.I. for population proportion p is where P(zc < z < zc) = % n > 30 is required. Just remember the formula!
E.g. 34 4000 items, 240 defective, find 95% C.I. for the probabilityp that an item is defective. Qs= 1 0.06 = 0.06 = 0.94 Ps= = 0.00375 Required 95% C.I. is = (0.0526 , 0.00674)
E.g. 35 Suppose that we know p = 0.6 for a Bernoulli population. How large is the size is necessary to be 95% confident that the obtained value p lies in (0.5,0.7) ? Let n = sample size. (0.5,0.7) = (0.60.1,0.6+0.1) Hence, for 95% confidence, 0.1 = On solving, n 92
E.g. 37 (a) Of 50 houseflies, independently subjected to the same insecticide, 38 were killed. Obtain an estimate of p, the probability that a housefly is killed by the insecticide. Find also the standard error of p. Ps = Standard error =
(b) Now conduct a larger experiment with the same insecticide so that an estimate with standard error of about 0.03 can be quoted. On the basis of the information in the experiment already conducted, how many houseflies needed ? Standard error = So n = 203 (c) To be absolutely sure of obtaining the desired accuracy, how many houseflies should be taken ? n = 203 makes standard error = 0.03 only when Ps = 19/25. Standard error depends on Ps. So what n to ensure s.e. 0.03 irrespective of Ps ?
For fixed n, s.e. is a function of Ps. s.e. 0.03 means max. of s.e. = 0.03. Very easy to show that Ps(1-Ps) attains max. when p = 0.5 Hence s.e. Then set n 279 i.e.Though different samples yield different Ps, it is sure that s.e. not greater than 0.03 if we take n= 279 (or more)