Download
1 / 9
90 likes | 289 Views
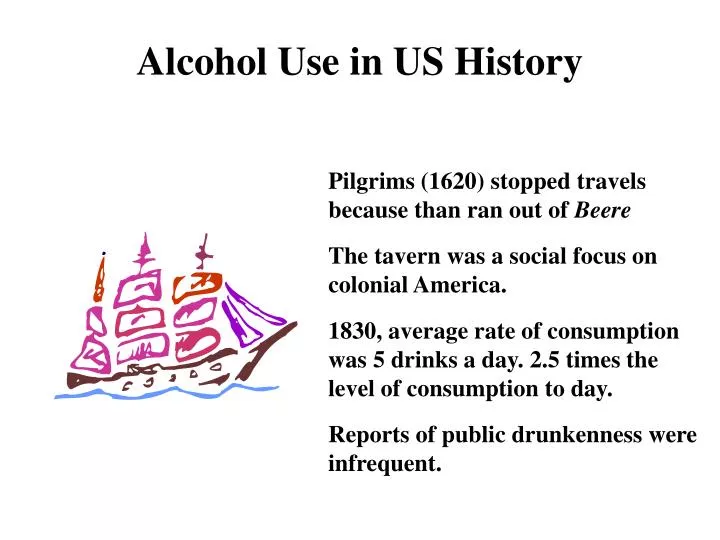
Alcohol Use in US History. Pilgrims (1620) stopped travels because than ran out of Beere The tavern was a social focus on colonial America. 1830, average rate of consumption was 5 drinks a day. 2.5 times the level of consumption to day. Reports of public drunkenness were infrequent.

E N D
Alcohol Use in US History • Pilgrims (1620) stopped travels because than ran out of Beere • The tavern was a social focus on colonial America. • 1830, average rate of consumption was 5 drinks a day. 2.5 times the level of consumption to day. • Reports of public drunkenness were infrequent.
Patterns of Alcohol Consumption • 30% percent of Americans who drink account for 80% of alcohol consumed. • 10% (of the above) account for approximately 50% of al the alcohol consumed. • A small proportion of the US population accounts for most of the alcohol consumed. • Steady decline in alcohol use since 1970 to 1999. Due to awareness of health, weight, and fitness
Demographics of Alcohol Consumption • Women are more likely to prefer wine to beer. • Preference for wine increases with age. • Increased years of education are associated with preference of wine. • College students consume a large amount of alcohol.
Temperance Movement • Women’s Christian Temperance Movement was established in 1873. • Original goals were for moderation of use. • 1917: 18th amendment prohibited the the use, transportation, or manufacturing of alcohol • Initial decrease in alcohol related deaths. • Rise in organized crime. • 1933: 21st amendment repealed prohibition
Acute Physiological Effects • Initial increase in diuretic effect-Later increase in antidiuretic effect. • Impairs REM sleep patterns • Hangovers • Result of Congeners • Irritation of stomach • Antidiuresis may lead to headaches
Sex and Alcohol • Men: • - Expectations ( placebo studies - greater penile response) • -Decrease sexual desire and performance • Women: • -Subjective response indicates increased sexual desire • -Physiological sexual responses decrease
Alcohol and College Performance • At 2 and 4 year institutions, the heaviest drinkers have the lowest grades • One out of three students at 4 year institutions report missing class dues to alcohol or other drug use • A 1991, study showed that: • A students averaged 3.6 drinks per week • B students averaged 5.5 drinks per week • C students averaged 7.6 drinks per week • D/F students averaged 10.6 drinks per week
Alcohol and Sexual Assault • 1996 Details survey of 2000 college students revealed: • 76% had sex with someone who was under the influence alcohol or other drugs • 5% had sex with someone who incoherently drunk or unconscious