Download
1 / 66
710 likes | 874 Views
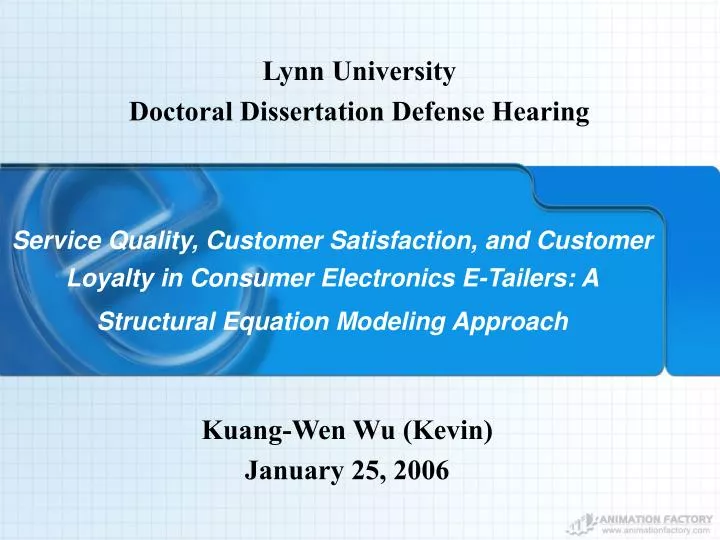
Lynn University Doctoral Dissertation Defense Hearing. Service Quality, Customer Satisfaction, and Customer Loyalty in Consumer Electronics E-Tailers: A Structural Equation Modeling Approach. Kuang-Wen Wu (Kevin) January 25, 2006. AGENDA. Introduction to the Study

E N D
Lynn UniversityDoctoral Dissertation Defense Hearing Service Quality, Customer Satisfaction, and Customer Loyalty in Consumer Electronics E-Tailers: A Structural Equation Modeling Approach Kuang-Wen Wu (Kevin) January 25, 2006
AGENDA • Introduction to the Study • Literature Review, Theoretical Framework, and Research Questions • Methodology • Results • Discussion • Questions and/or Comments
Purpose of the Study • To validate the dimensions of E-S-QUAL and E-RecS-QUAL for CE e-tailers • To validate the ACSI model • To link the construct of service recovery to the ACSI model
Definition of Terms Types of Variables Manifest Variable 1 Manifest Variable 4 Exogenous Latent Variable Endogenous Latent Variable Manifest Variable 2 Manifest Variable 5 Manifest Variable 3 Manifest Variable 6
Justification • Significance • No previous study focused on CE e-tailers • No previous study examined E-S-QUAL and E-RecS-QUAL in the CE field • The instruments are new, and in need of further psychometric evaluation • Researchability • All variables could be measured • Feasibility • Subjects were available • Concepts could be measured
Delimitations • Only nine categories of CE products (by CEA) • Geographic setting – The continental U.S. • U.S.-based CE e-tailers • Participants • 18+ • Read and write English • Lived in the U.S. • Previous online purchase of CE
LITERATURE REVIEW, THEORETICAL FRAMEWORK, AND RESEARCH QUESTIONS
Literature Review • Customer Satisfaction • Antecedents of Customer Satisfaction • Customer Expectations • Performance • Equity • Consequences of Customer Satisfaction • Customer Loyalty • Customer Complaints • Service Quality • Electronic Service Quality • Service Recovery
Literature Review (cont.) • ACSI Model (Fornell et al., 1996) Perceived Quality Customer Complaints + - Overall Customer Satisfaction (ACSI) + Perceived Value + + + Customer Expectations Customer Loyalty + +
Theoretical Framework • Hypothesized Electronic Service Quality Model Efficiency Responsiveness H2a H1a Fulfillment Electronic Service Quality Electronic Recovery Service Quality H1b H2b Compensation System Availability H1c H2c Contact H1d Privacy
Theoretical Framework (cont.) • Hypothesized Electronic Customer Satisfaction (e-CS) Model Electronic Recovery Service Quality Electronic Service Quality Customer Complaints H10 H9 H11 H3 Customer Satisfaction H7 Perceived Value H4 H6 H8 Customer Expectations Customer Loyalty H12 H5
Research Design & Population • Research Design • Quantitative, non-experimental • Correlational • Online survey • Questionnaire: 70 questions in 11 sections • Target Population • All American online CE shoppers • Accessible Population • Online CE shoppers who could be reached by e-mail
Sampling Plan • Quota and Snowball Sampling Plan • Non-probability sample • Quota sample: 320 • 50% male • 60% under 45 years old • 60% with some college or more • 55% with family income less than $75K • Sent invitation e-mails to the quota sample
Instrumentation (cont.) • A Sample Print Out of Online Survey
Procedures Obtained permission to use scales Designed a Web site for online survey Received approval from IRB Sent invitation e-mails (Bcc feature) Participation is voluntary 8-10 minutes to complete Anonymous Did not track IP address Did not track personal identification information Collected data for two months
Methods of Data Analysis • Descriptive Statistics • SPSS 11.5 • Confirmatory Factor Analysis • Structural Equation Modeling (SEM) • Measurement Model Assessment • Structural Model Assessment • Goodness-of-Fit Criteria • Absolute Fit Measures • Incremental Fit Measures • Parsimonious Fit Measures • AMOS 5.0
Methods of Data Analysis (cont.) • Goodness-of-Fit Criteria • Absolute Fit Measures • To determine the degree to which the overall model fits the sample data • Incremental Fit Measures • To compare the proposed model to a baseline model • Parsimonious Fit Measures • To diagnose whether model fit has been achieved by over-fitting the data with too many coefficients
Evaluation of Research Methods • Internal Validity • The instruments have evidence of good estimates of reliability and validity • Methods of data analysis strengthen internal validity • External Validity • Quota samples strengthen the external validity • Non-random samples may cause sampling bias • The results may be difficult to generalize to the target population • Generalizing will depend upon how closely the final data-producing sample matches the "quota".
Socio-Demographic Characteristics • Gender (N = 274)
Socio-Demographic Characteristics (cont.) • Age (M = 35.23; SD = 10.9); (N = 268) • 26-35 (47%)
Socio-Demographic Characteristics (cont.) • Marital Status (N = 276) • Married (52%)
Socio-Demographic Characteristics (cont.) • Employment Status (N = 276) • Full-time (80%)
Socio-Demographic Characteristics (cont.) • Hollingshead’s Occupation Scale (N = 274) • Business Managers (26.3%)
Socio-Demographic Characteristics (cont.) • Hollingshead’s Education Scale (N = 276) • Professional/Graduate (40.6%)
Socio-Demographic Characteristics (cont.) • Index of Social Position (N = 253) • Upper-Middle Class (50%)
Socio-Demographic Characteristics (cont.) • Annual Household Income (N = 273) • $60K-$74,999 (19.4%)
Socio-Demographic Characteristics (cont.) • Annual Personal Income (N = 272) • $30K-$44,999 (22.4%)
Online Purchasing Characteristics • Purchasing Frequency (N = 273) • Less than once a month (72%)
Online Purchasing Characteristics (cont.) • Last Purchase (N = 273) • Six months to one year ago (25.6%)
Online Purchasing Characteristics (cont.) • Annual Spending (N = 272) • $101-$300 (26.5%)
Online Purchasing Characteristics (cont.) • Negative Experiences (N = 276)
Hypothesis 1 • 22 items 17 items Efficiency H1a Fulfillment Electronic Service Quality H1b System Availability H1c H1d Privacy
Hypothesis 2 • 3 Dimensions 2 Dimensions Responsiveness H2a Electronic Recovery Service Quality Compensation H2b H2c Contact
Hypothesis 2 (cont.) Responsiveness and Contact Electronic Recovery Service Quality Compensation
Hypotheses 3 through 8 • e-SQ CS (t = -2.19; p < .05) • CE CS (t = .50; p > .05) Electronic Recovery Service Quality Electronic Service Quality Customer Complaints H10 H9 H11 H3 Customer Satisfaction H7 Perceived Value H4 H6 H8 Customer Expectations Customer Loyalty H12 H5
Hypotheses 3 through 8 (cont.) • H3 and H5 were not supported. Electronic Service Quality - Customer Satisfaction + Perceived Value + + + Customer Expectations
Hypothesis 9 • e-RecSQ CS (t = 1; p > .05) • Not supported Electronic Recovery Service Quality Electronic Service Quality Customer Complaints H10 H9 H11 H3 Customer Satisfaction H7 Perceived Value H4 H6 H8 Customer Expectations Customer Loyalty H12 H5
Hypothesis 10 • Supported Electronic Recovery Service Quality Electronic Service Quality Customer Complaints H10 t = 7.4; p < .01 H9 H11 H3 Customer Satisfaction H7 Perceived Value H4 H6 H8 Customer Expectations Customer Loyalty H12 H5
Hypotheses 11 and 12 • Supported Electronic Recovery Service Quality Electronic Service Quality Customer Complaints H10 H9 H11 H3 Customer Satisfaction H7 Perceived Value H4 H6 H8 Customer Expectations Customer Loyalty H12 H5