Download
1 / 70
710 likes | 849 Views
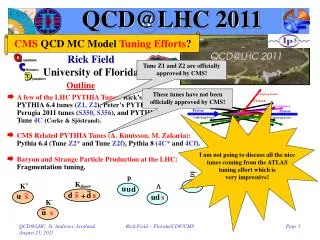
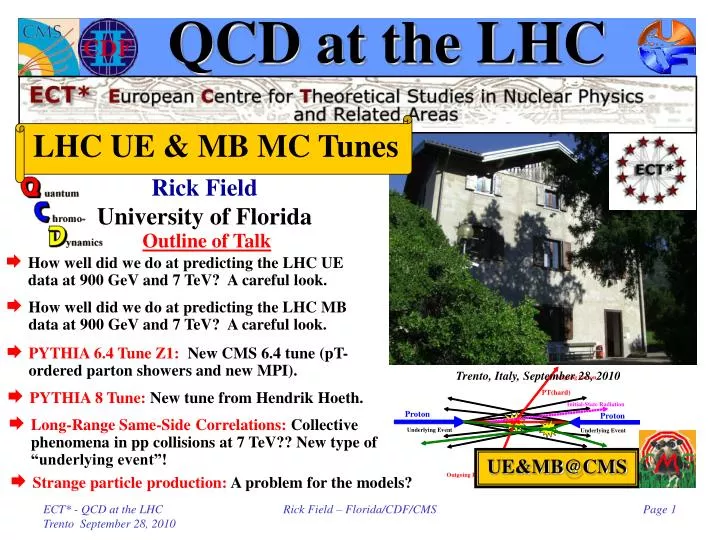
QCD at the LHC. LHC UE & MB MC Tunes. Rick Field University of Florida. Outline of Talk. How well did we do at predicting the LHC UE data at 900 GeV and 7 TeV? A careful look. How well did we do at predicting the LHC MB data at 900 GeV and 7 TeV? A careful look.

E N D
QCD at the LHC LHC UE & MB MC Tunes Rick Field University of Florida Outline of Talk • How well did we do at predicting the LHC UE data at 900 GeV and 7 TeV? A careful look. • How well did we do at predicting the LHC MB data at 900 GeV and 7 TeV? A careful look. • PYTHIA 6.4 Tune Z1: New CMS 6.4 tune (pT-ordered parton showers and new MPI). Trento, Italy, September 28, 2010 • PYTHIA 8 Tune: New tune from Hendrik Hoeth. • Long-Range Same-Side Correlations: Collective phenomena in pp collisions at 7 TeV?? New type of “underlying event”! UE&MB@CMS • Strange particle production: A problem for the models? Rick Field – Florida/CDF/CMS
PYTHIA Tune DW • CMS preliminary data at 900 GeV and 7 TeV on the “transverse” charged particle density, dN/dhdf, as defined by the leading charged particle jet (chgjet#1) for charged particles with pT > 0.5 GeV/c and |h| < 2. The data are uncorrected and compared with PYTHIA Tune DW after detector simulation. Rick Field – Florida/CDF/CMS
PYTHIA Tune DW • ATLAS preliminary data at 900 GeV and 7 TeV on the “transverse” charged particle density, dN/dhdf, as defined by the leading charged particle (PTmax) for charged particles with pT > 0.5 GeV/c and |h| < 2.5. The data are corrected and compared with PYTHIA Tune DW at the generator level. Rick Field – Florida/CDF/CMS
PYTHIA Tune DW CMS ATLAS • ATLAS preliminary data at 900 GeV and 7 TeV on the “transverse” charged particle density, dN/dhdf, as defined by the leading charged particle (PTmax) for charged particles with pT > 0.5 GeV/c and |h| < 2.5. The data are corrected and compared with PYTHIA Tune DW at the generator level. • CMS preliminary data at 900 GeV and 7 TeV on the “transverse” charged particle density, dN/dhdf, as defined by the leading charged particle jet (chgjet#1) for charged particles with pT > 0.5 GeV/c and |h| < 2. The data are uncorrected and compared with PYTHIA Tune DW after detector simulation. Rick Field – Florida/CDF/CMS
PYTHIA Tune DW CMS ATLAS • ATLAS preliminary data at 900 GeV and 7 TeV on the “transverse” charged PTsum density, dPT/dhdf, as defined by the leading charged particle (PTmax) for charged particles with pT > 0.5 GeV/c and |h| < 2.5. The data are corrected and compared with PYTHIA Tune DW at the generator level. • CMS preliminary data at 900 GeV and 7 TeV on the “transverse” charged PTsum density, dPT/dhdf, as defined by the leading charged particle jet (chgjet#1) for charged particles with pT > 0.5 GeV/c and |h| < 2. The data are uncorrected and compared with PYTHIA Tune DW after detector simulation. Rick Field – Florida/CDF/CMS
PYTHIA Tune DW CDF • CDF published data at 1.96 TeV on the “transverse” charged particle density, dN/dhdf, as defined by the leading calorimeter jet (jet#1) for charged particles with pT > 0.5 GeV/c and |h| < 1.0. The data are corrected and compared with PYTHIA Tune DW at the generator level. Rick Field – Florida/CDF/CMS
PYTHIA Tune DW CMS CDF • CMS preliminary data at 900 GeV and 7 TeV on the “transverse” charged particle density, dN/dhdf, as defined by the leading charged particle jet (chgjet#1) for charged particles with pT > 0.5 GeV/c and |h| < 2. The data are uncorrected and compared with PYTHIA Tune DW after detector simulation. • CDF published data at 1.96 TeV on the “transverse” charged particle density, dN/dhdf, as defined by the leading calorimeter jet (jet#1) for charged particles with pT > 0.5 GeV/c and |h| < 1.0. The data are corrected and compared with PYTHIA Tune DW at the generator level. Rick Field – Florida/CDF/CMS
PYTHIA Tune DW CMS • CMS preliminary data at 900 GeV and 7 TeV on the “transverse” charged particle density, dN/dhdf, as defined by the leading charged particle jet (chgjet#1) for charged particles with pT > 0.5 GeV/c and |h| < 2. The data are uncorrected and compared with PYTHIA Tune DW after detector simulation. • CDF published data at 1.96 TeV on the “transverse” charged particle density, dN/dhdf, as defined by the leading calorimeter jet (jet#1) for charged particles with pT > 0.5 GeV/c and |h| < 1.0. The data are corrected and compared with PYTHIA Tune DW at the generator level. Rick Field – Florida/CDF/CMS
“Transverse” Charge Density Rick Field MB&UE@CMS Workshop CERN, November 6, 2009 factor of 2! 900 GeV → 7 TeV (UE increase ~ factor of 2) LHC 900 GeV LHC 7 TeV ~0.4 → ~0.8 • Shows the charged particle density in the “transverse” region for charged particles (pT > 0.5 GeV/c, |h| < 2) at 900 GeV and 7 TeVas defined by PTmax from PYTHIATune DW andat the particle level (i.e. generator level). Rick Field – Florida/CDF/CMS
PYTHIA Tune DW CMS ATLAS • Ratio of CMS preliminary data at 900 GeV and 7 TeV on the “transverse” charged particle density, dN/dhdf, as defined by the leading charged particle jet (chgjet#1) for charged particles with pT > 0.5 GeV/c and |h| < 2. The data are uncorrected and compared with PYTHIA Tune DW after detector simulation. • Ratio of the ATLAS preliminary data at 900 GeV and 7 TeV on the “transverse” charged particle density, dN/dhdf, as defined by the leading charged particle (PTmax) for charged particles with pT > 0.5 GeV/c and |h| < 2.5. The data are corrected and compared with PYTHIA Tune DW at the generator level. Rick Field – Florida/CDF/CMS
PYTHIA Tune DW CMS ATLAS • Ratio of the ATLAS preliminary data at 900 GeV and 7 TeV on the “transverse” charged PTsum density, dPT/dhdf, as defined by the leading charged particle (PTmax) for charged particles with pT > 0.5 GeV/c and |h| < 2.5. The data are corrected and compared with PYTHIA Tune DW at the generator level. • Ratio of the CMS preliminary data at 900 GeV and 7 TeV on the “transverse” charged PTsum density, dPT/dhdf, as defined by the leading charged particle jet (chgjet#1) for charged particles with pT > 0.5 GeV/c and |h| < 2. The data are uncorrected and compared with PYTHIA Tune DW after detector simulation. Rick Field – Florida/CDF/CMS
“Transverse” Multiplicity Distribution Same hard scale at two different center-of-mass energies! CMS • CMS uncorrected data at 900 GeV and 7 TeV on the charged particle multiplicity distribution in the “transverse” region for charged particles (pT > 0.5 GeV/c, |h| < 2) as defined by the leading charged particle jet, chgjet#1, with PT(chgjet#1) > 3 GeV/c compared with PYTHIA Tune DW at the detector level (i.e. Theory + SIM). Shows the growth of the “underlying event” as the center-of-mass energy increases. Rick Field – Florida/CDF/CMS
“Transverse” Multiplicity Distribution Same center-of-mass energy at two different hard scales! CMS • CMS uncorrected data at 7 TeV on the charged particle multiplicity distribution in the “transverse” region for charged particles (pT > 0.5 GeV/c, |h| < 2) as defined by the leading charged particle jet, chgjet#1, with PT(chgjet#1) > 3 GeV/c and PT(chgjet#1) > 20 GeV/c compared with PYTHIA Tune DW at the detector level (i.e. Theory + SIM). Shows the growth of the “underlying event” as the hard scale increases. Rick Field – Florida/CDF/CMS
PYTHIA Tune DW How well did we do at predicting the “underlying event” at 900 GeV and 7 TeV? Tune DW Tune DW • I am surprised that the Tunes did as well as they did at predicting the behavior of the “underlying event” at 900 GeV and 7 TeV! Tune DW Rick Field – Florida/CDF/CMS
UE Summary • The “underlying event” at 7 TeV and 900 GeV is almost what we expected! With a little tuning we should be able to describe the data very well (see Tune Z1 later in this talk). • I am surprised that the Tunes did as well as they did at predicting the behavior of the “underlying event” at 900 GeV and 7 TeV! Remember this is “soft” QCD! PARP(82) PARP(90) • “Min-Bias” is a whole different story! Much more complicated due to diffraction! Color Diffraction Connections Rick Field – Florida/CDF/CMS
UE Summary Warning! All the UE studies look at charged particles with pT > 0.5 GeV/c. We do not know if the models correctly describe the UE at lower pT values! • The “underlying event” at 7 TeV and 900 GeV is almost what we expected! With a little tuning we should be able to describe the data very well. • I am surprised that the Tunes did as well as they did at predicting the behavior of the “underlying event” at 900 GeV and 7 TeV! Remember this is “soft” QCD! PARP(82) PARP(90) • “Min-Bias” is a whole different story! Much more complicated due to diffraction! Color Diffraction Connections Rick Field – Florida/CDF/CMS
Rick Field University of ChicagoJuly 11, 2006 “Back-to-Back” “Leading Jet” • Shows the data on the tower ETsum density, dETsum/dhdf, in the “transMAX” and “transMIN” region (ET > 100 MeV, |h| < 1) versus PT(jet#1) for “Leading Jet” and “Back-to-Back” events. • Compares the (corrected) data with PYTHIA Tune A (with MPI) and HERWIG (without MPI) at the particle level (all particles, |h| < 1). Rick Field – Florida/CDF/CMS
Rick Field University of ChicagoJuly 11, 2006 “Back-to-Back” “Leading Jet” Neither PY Tune A or HERWIG fits the ETsum density in the “transferse” region! HERWIG does slightly better than Tune A! • Shows the data on the tower ETsum density, dETsum/dhdf, in the “transMAX” and “transMIN” region (ET > 100 MeV, |h| < 1) versus PT(jet#1) for “Leading Jet” and “Back-to-Back” events. • Compares the (corrected) data with PYTHIA Tune A (with MPI) and HERWIG (without MPI) at the particle level (all particles, |h| < 1). Rick Field – Florida/CDF/CMS
Rick Field University of ChicagoJuly 11, 2006 “Leading Jet” “Back-to-Back” “transDIF” is more sensitive to the “hard scattering” component of the “underlying event”! • Use the leading jet to define the MAX and MIN “transverse” regions on an event-by-event basis with MAX (MIN) having the largest (smallest) charged PTsum density. • Shows the “transDIF” = MAX-MIN ETsum density, dETsum/dhdf, for all particles (|h| < 1) versus PT(jet#1) for “Leading Jet” and “Back-to-Back” events. Rick Field – Florida/CDF/CMS
Rick Field University of ChicagoJuly 11, 2006 Possible Scenario?? • PYTHIA Tune A fits the charged particle PTsum density for pT > 0.5 GeV/c, but it does not produce enough ETsum for towers with ET > 0.1 GeV. • It is possible that there is a sharp rise in the number of particles in the “underlying event” at low pT (i.e. pT < 0.5 GeV/c). • Perhaps there are two components, a vary “soft” beam-beam remnant component (Gaussian or exponential) and a “hard” multiple interaction component. Rick Field – Florida/CDF/CMS
LHC MB Predictions: 900 GeV • Compares the 900 GeV ALICE data with PYTHIA Tune DW and Tune S320 Perugia 0. Tune DW uses the old Q2-ordered parton shower and the old MPI model. Tune S320 uses the new pT-ordered parton shower and the new MPI model. The numbers in parentheses are the average value of dN/dh for the region |h| < 0.6. Rick Field – Florida/CDF/CMS
LHC MB Predictions: 900 GeV Off by 11%! • Compares the 900 GeV data with PYTHIA Tune DW and Tune S320 Perugia 0. Tune DW uses the old Q2-ordered parton shower and the old MPI model. Tune S320 uses the new pT-ordered parton shower and the new MPI model. The numbers in parentheses are the average value of dN/dh for the region |h| < 0.6. Rick Field – Florida/CDF/CMS
ATLAS INEL dN/dh • None of the tunes fit the ATLAS INEL dN/dh data with PT > 100 MeV! They all predict too few particles. Off by 20-50%! • The ATLAS Tune AMBT1 was designed to fit the inelastic data for Nchg ≥ 6 with pT > 0.5 GeV/c! Soft particles! Rick Field – Florida/CDF/CMS
PYTHIA Tune DW If one increases the hard scale the agreement improves! Tune DW • ALICE inelastic data at 900 GeV on the dN/dh distribution for charged particles (pT > PTmin) for events with at least one charged particle with pT > PTmin and |h| < 0.8 for PTmin = 0.15 GeV/c, 0.5 GeV/c, and 1.0 GeV/c compared with PYTHIA Tune DW at the generator level. The same thing occurs at 7 TeV! ALICE, ATLAS, and CMS data coming soon. Rick Field – Florida/CDF/CMS
PYTHIA Tune DW Diffraction contributes less at harder scales! Tune DW • ALICE inelastic data at 900 GeV on the dN/dh distribution for charged particles (pT > PTmin) for events with at least one charged particle with pT > PTmin and |h| < 0.8 for PTmin = 0.15 GeV/c, 0.5 GeV/c, and 1.0 GeV/c compared with PYTHIA Tune Z1 at the generator level (dashed = ND, solid = INEL). Cannot trust PYTHIA 6.2 modeling of diffraction! Rick Field – Florida/CDF/CMS
CMS dN/dh CMS Tune DW Soft particles! All pT • Generator level dN/dh (all pT). Shows the NSD = HC + DD and the HC = ND contributions for Tune DW. Also shows the CMS NSD data. Off by 50%! Rick Field – Florida/CDF/CMS
CMS dN/dh Okay if the Monte-Carlo does not fit the data what do we do? We tune the Monte-Carlo to fit the data! CMS Tune DW Soft particles! All pT • Generator level dN/dh (all pT). Shows the NSD = HC + DD and the HC = ND contributions for Tune DW. Also shows the CMS NSD data. Off by 50%! Rick Field – Florida/CDF/CMS
CMS dN/dh Okay if the Monte-Carlo does not fit the data what do we do? We tune the Monte-Carlo to fit the data! Be careful not to tune away new physics! CMS Tune DW Soft particles! All pT • Generator level dN/dh (all pT). Shows the NSD = HC + DD and the HC = ND contributions for Tune DW. Also shows the CMS NSD data. Off by 50%! Rick Field – Florida/CDF/CMS
PYTHIA Tune Z1 • All my previous tunes (A, DW, DWT, D6, D6T, CW, X1, and X2) were PYTHIA 6.4 tunes using the old Q2-ordered parton showers and the old MPI model (really 6.2 tunes)! PARP(90) PARP(82) Color • I believe that it is time to move to PYTHIA 6.4 (pT-ordered parton showers and new MPI model)! Connections Diffraction • Tune Z1: I started with the parameters of ATLAS Tune AMBT1, but I changed LO* to CTEQ5L and I varied PARP(82) and PARP(90) to get a very good fit of the CMS UE data at 900 GeV and 7 TeV. • The ATLAS Tune AMBT1 was designed to fit the inelastic data for Nchg ≥ 6 and to fit the PTmax UE data with PTmax > 10 GeV/c. Tune AMBT1 is primarily a min-bias tune, while Tune Z1 is a UE tune! UE&MB@CMS Rick Field – Florida/CDF/CMS
PYTHIA Tune Z1 Parameters not shown are the PYTHIA 6.4 defaults! Rick Field – Florida/CDF/CMS
PYTHIA Tune Z1 CMS CMS Tune Z1 • CMS preliminary data at 900 GeV and 7 TeV on the “transverse” charged particle density, dN/dhdf, as defined by the leading charged particle jet (chgjet#1) for charged particles with pT > 0.5 GeV/c and |h| < 2.0. The data are uncorrected and compared with PYTHIA Tune DW and D6T after detector simulation (SIM). • CMS preliminary data at 900 GeV and 7 TeV on the “transverse” charged particle density, dN/dhdf, as defined by the leading charged particle jet (chgjet#1) for charged particles with pT > 0.5 GeV/c and |h| < 2.0. The data are uncorrected and compared with PYTHIA Tune Z1 after detector simulation (SIM). Tune Z1 (CTEQ5L) PARP(82) = 1.932 PARP(90) = 0.275 PARP(77) = 1.016 PARP(78) = 0.538 Color reconnection suppression. Color reconnection strength. Tune Z1 is a PYTHIA 6.4 using pT-ordered parton showers and the new MPI model! Rick Field – Florida/CDF/CMS
PYTHIA Tune Z1 CMS CMS Tune Z1 • CMS preliminary data at 900 GeV and 7 TeV on the “transverse” charged PTsum density, dPT/dhdf, as defined by the leading charged particle jet (chgjet#1) for charged particles with pT > 0.5 GeV/c and |h| < 2.0. The data are uncorrected and compared with PYTHIA Tune DW and D6T after detector simulation (SIM). • CMS preliminary data at 900 GeV and 7 TeV on the “transverse” charged PTsum density, dPT/dhdf, as defined by the leading charged particle jet (chgjet#1) for charged particles with pT > 0.5 GeV/c and |h| < 2.0. The data are uncorrected and compared with PYTHIA Tune Z1 after detector simulation (SIM). Tune Z1 (CTEQ5L) PARP(82) = 1.932 PARP(90) = 0.275 PARP(77) = 1.016 PARP(78) = 0.538 Color reconnection suppression. Color reconnection strength. Tune Z1 is a PYTHIA 6.4 using pT-ordered parton showers and the new MPI model! Rick Field – Florida/CDF/CMS
PYTHIA Tune Z1 ATLAS ATLAS Tune Z1 Tune Z1 • ATLAS preliminary data at 900 GeV and 7 TeV on the “transverse” charged particle density, dN/dhdf, as defined by the leading charged particle (PTmax) for charged particles with pT > 0.5 GeV/c and |h| < 2.5. The data are corrected and compared with PYTHIA Tune Z1 at the generator level. • ATLAS preliminary data at 900 GeV and 7 TeV on the “transverse” charged PTsum density, dPT/dhdf, as defined by the leading charged particle (PTmax) for charged particles with pT > 0.5 GeV/c and |h| < 2.5. The data are corrected and compared with PYTHIA Tune Z1 at the generrator level. Tune Z1 (CTEQ5L) PARP(82) = 1.932 PARP(90) = 0.275 PARP(77) = 1.016 PARP(78) = 0.538 Color reconnection suppression. Color reconnection strength. Tune Z1 is a PYTHIA 6.4 using pT-ordered parton showers and the new MPI model! Rick Field – Florida/CDF/CMS
PYTHIA Tune Z1 Tune Z1 CMS CMS • Ratio of CMS preliminary data at 900 GeV and 7 TeV (7 TeV divided by 900 GeV) on the “transverse” charged particle density as defined by the leading charged particle jet (chgjet#1) for charged particles with pT > 0.5 GeV/c and |h| < 2.0. The data are uncorrected and compared with PYTHIA Tune DW, D6T, CW, and P0 after detector simulation (SIM). • Ratio of CMS preliminary data at 900 GeV and 7 TeV (7 TeV divided by 900 GeV) on the “transverse” charged particle density as defined by the leading charged particle jet (chgjet#1) for charged particles with pT > 0.5 GeV/c and |h| < 2.0. The data are uncorrected and compared with PYTHIA Tune Z1 after detector simulation (SIM). Rick Field – Florida/CDF/CMS
PYTHIA Tune Z1 Tune Z1 CMS CMS • Ratio of CMS preliminary data at 900 GeV and 7 TeV (7 TeV divided by 900 GeV) on the “transverse” charged PTsum density as defined by the leading charged particle jet (chgjet#1) for charged particles with pT > 0.5 GeV/c and |h| < 2.0. The data are uncorrected and compared with PYTHIA Tune DW, D6T, CW, and P0 after detector simulation (SIM). • Ratio of CMS preliminary data at 900 GeV and 7 TeV (7 TeV divided by 900 GeV) on the “transverse” charged PTsum density as defined by the leading charged particle jet (chgjet#1) for charged particles with pT > 0.5 GeV/c and |h| < 2.0. The data are uncorrected and compared with PYTHIA Tune Z1 after detector simulation (SIM). Rick Field – Florida/CDF/CMS
PYTHIA Tune Z1 Tune Z1 Tune Z1 ATLAS ATLAS • Ratio of the ATLAS preliminary data on the charged particle density in the “transverse” region for charged particles (pT > 0.5 GeV/c, |h| < 2.5) at 900 GeV and 7 TeVas defined by PTmax compared with PYTHIA Tune Z1 at the generator level. • Ratio of the ATLAS preliminary data on the charged PTsum density in the “transverse” region for charged particles (pT > 0.5 GeV/c, |h| < 2.5) at 900 GeV and 7 TeVas defined by PTmax compared with PYTHIA Tune Z1 at the generator level. Rick Field – Florida/CDF/CMS
PYTHIA Tune Z1 Tune Z1 CMS CDF Tune Z1 • CMS preliminary data at 900 GeV and 7 TeV on the “transverse” charged particle density, dN/dhdf, as defined by the leading charged particle jet (chgjet#1) for charged particles with pT > 0.5 GeV/c and |h| < 2. The data are uncorrected and compared with PYTHIA Tune Z1 after detector simulation. • CDF published data at 1.96 TeV on the “transverse” charged particle density, dN/dhdf, as defined by the leading calorimeter jet (jet#1) for charged particles with pT > 0.5 GeV/c and |h| < 1.0. The data are corrected and compared with PYTHIA Tune Z1 at the generator level. Rick Field – Florida/CDF/CMS
PYTHIA Tune Z1 Oops Tune Z1 is slightly high at CDF! Tune Z1 CMS CDF Tune Z1 • CMS preliminary data at 900 GeV and 7 TeV on the “transverse” charged particle density, dN/dhdf, as defined by the leading charged particle jet (chgjet#1) for charged particles with pT > 0.5 GeV/c and |h| < 2. The data are uncorrected and compared with PYTHIA Tune Z1 after detector simulation. • CDF published data at 1.96 TeV on the “transverse” charged particle density, dN/dhdf, as defined by the leading calorimeter jet (jet#1) for charged particles with pT > 0.5 GeV/c and |h| < 1.0. The data are corrected and compared with PYTHIA Tune Z1 at the generator level. Rick Field – Florida/CDF/CMS
PYTHIA Tune Z1 pT0(W)=pT0(W/W0)e • MPI Cut-Off versus the Center-of Mass Energy Wcm: PYTHIA Tune Z1 was determined by fitting pT0 independently at 900 GeV and 7 TeV and calculating e = PARP(90). The best fit to pT0 at CDF is slightly higher than the Tune Z1 curve. This is very preliminary! Perhaps with a global fit to all three energies (i.e. “Professor” tune) one can get a simultaneous fit to all three?? pT0(W)=pT0(W/W0)e e = PARP(90) pT0 = PARP(82) W = Ecm Rick Field – Florida/CDF/CMS
PYTHIA Tune Z1 More UE activity for W > 7 TeV!?? • MPI Cut-Off versus the Center-of Mass Energy Wcm: PYTHIA Tune Z1 was determined by fitting pT0 independently at 900 GeV and 7 TeV and calculating e = PARP(90). The best fit to pT0 at CDF is slightly higher than the Tune Z1 curve. This is very preliminary! Perhaps with a global fit to all three energies (i.e. “Professor” tune) one can get a simultaneous fit to all three?? pT0(W)=pT0(W/W0)e e = PARP(90) pT0 = PARP(82) W = Ecm Rick Field – Florida/CDF/CMS
PYTHIA 8 Tunes • New PYTHIA 8.142 “professor” tune from Hendrik Hoeth. Hendrik Hoeth ISMD2010 New PYTHIA 8 tune! Rick Field – Florida/CDF/CMS
PYTHIA 8 Tunes • New PYTHIA 8.142 “professor” tune from Hendrik Hoeth. New PYTHIA 8 tune! Hendrik Hoeth ISMD2010 Rick Field – Florida/CDF/CMS
PYTHIA 8 Tunes • New PYTHIA 8.142 “professor” tune from Hendrik Hoeth. Hendrik Hoeth ISMD2010 Low at 900 GeV! • Fits nicely 1.96 TeV and 7 TeV, but is low at 900 GeV! Rick Field – Florida/CDF/CMS
“Transverse” Multiplicity Distribution CMS CMS Tune Z1 • CMS uncorrected data at 900 GeV and 7 TeV on the charged particle multiplicity distribution in the “transverse” region for charged particles (pT > 0.5 GeV/c, |h| < 2) as defined by the leading charged particle jet with PT(chgjet#1) > 3 GeV/c compared with PYTHIA Tune Z1 at the detector level (i.e. Theory + SIM). • CMS uncorrected data at 900 GeV and 7 TeV on the charged particle multiplicity distribution in the “transverse” region for charged particles (pT > 0.5 GeV/c, |h| < 2) as defined by the leading charged particle jet with PT(chgjet#1) > 3 GeV/c compared with PYTHIA Tune DW and Tune D6T at the detector level (i.e. Theory + SIM). Rick Field – Florida/CDF/CMS
“Transverse” PTsum Distribution CMS CMS Tune Z1 • CMS uncorrected data at 900 GeV and 7 TeV on the charged scalar PTsum distribution in the “transverse” region for charged particles (pT > 0.5 GeV/c, |h| < 2) as defined by the leading charged particle jet with PT(chgjet#1) > 3 GeV/c compared with PYTHIA Tune DW,andTune D6T at the detector level (i.e. Theory + SIM). • CMS uncorrected data at 900 GeV and 7 TeV on the charged scalar PTsum distribution in the “transverse” region for charged particles (pT > 0.5 GeV/c, |h| < 2) as defined by the leading charged particle jet with PT(chgjet#1) > 3 GeV/c compared with PYTHIA Tune Z1,at the detector level (i.e. Theory + SIM). Rick Field – Florida/CDF/CMS
“Transverse” Multiplicity Distribution CMS CMS Tune Z1 • CMS uncorrected data at 7 TeV on the charged particle multiplicity distribution in the “transverse” region for charged particles (pT > 0.5 GeV/c, |h| < 2) as defined by the leading charged particle jet with PT(chgjet#1) > 3 GeV/c and PT(chgjet#1) > 20 GeV/c compared with PYTHIA Tune Z1 at the detector level (i.e. Theory + SIM). • CMS uncorrected data at 7 TeV on the charged particle multiplicity distribution in the “transverse” region for charged particles (pT > 0.5 GeV/c, |h| < 2) as defined by the leading charged particle jet with PT(chgjet#1) > 3 GeV/c and PT(chgjet#1) > 20 GeV/c compared with PYTHIA Tune DW and Tune D6T at the detector level (i.e. Theory + SIM). Rick Field – Florida/CDF/CMS
“Transverse” Multiplicity Distribution Difficult to produce enough events with large “transverse” multiplicity at low hard scale! Tune Z1 CMS • CMS uncorrected data at 7 TeV on the charged particle multiplicity distribution in the “transverse” region for charged particles (pT > 0.5 GeV/c, |h| < 2) as defined by the leading charged particle jet, chgjet#1, with PT(chgjet#1) > 3 GeV/c and PT(chgjet#1) > 20 GeV/c compared with PYTHIA Tune Z1 at the detector level (i.e. Theory + SIM). Rick Field – Florida/CDF/CMS
“Transverse” PTsum Distribution CMS CMS Tune Z1 • CMS uncorrected data at 7 TeV on the charged PTsum distribution in the “transverse” region for charged particles (pT > 0.5 GeV/c, |h| < 2) as defined by the leading charged particle jet with PT(chgjet#1) > 3 GeV/c and PT(chgjet#1) > 20 GeV/c compared with PYTHIA Tune Z1 at the detector level (i.e. Theory + SIM). • CMS uncorrected data at 7 TeV on the charged PTsum distribution in the “transverse” region for charged particles (pT > 0.5 GeV/c, |h| < 2) as defined by the leading charged particle jet with PT(chgjet#1) > 3 GeV/c and PT(chgjet#1) > 20 GeV/c compared with PYTHIA Tune DW and Tune D6T at the detector level (i.e. Theory + SIM). Rick Field – Florida/CDF/CMS
“Transverse” PTsum Distribution Difficult to produce enough events with large “transverse” PTsum at low hard scale! Tune Z1 CMS • CMS uncorrected data at 7 TeV on the charged PTsum distribution in the “transverse” region for charged particles (pT > 0.5 GeV/c, |h| < 2) as defined by the leading charged particle jet, chgjet#1, with PT(chgjet#1) > 3 GeV/c and PT(chgjet#1) > 20 GeV/c compared with PYTHIA Tune Z1 at the detector level (i.e. Theory + SIM). Rick Field – Florida/CDF/CMS
CMS dN/dh Tune Z1 CMS CMS • Generator level dN/dh (all pT). Shows the NSD = HC + DD and the HC = ND contributions for Tune Z1. Also shows the CMS NSD data. • Generator level dN/dh (all pT). Shows the NSD = HC + DD prediction for Tune Z1 and Tune X2. Also shows the CMS NSD data. Okay not perfect, but remember we do not know if the DD is correct! Rick Field – Florida/CDF/CMS