Download
1 / 18
180 likes | 310 Views
Section 2.5 The Normal Distribution. Statistics Chapter 2 Exploring Distributions. Central Intervals for Normal Dist. 68% of values lie within 1 SD of the mean. Including to the right and left 90% of the values lie with 1.645 SDs of the mean.

E N D
Section 2.5 The Normal Distribution StatisticsChapter 2 Exploring Distributions
Central Intervals for Normal Dist. • 68% of values lie within 1 SD of the mean. • Including to the right and left • 90% of the values lie with 1.645 SDs of the mean. • 95% lie within about 2 SDs (actually 1.96 SDs) of the mean. • 99.7% of the data lie within 3 SDs of the mean.
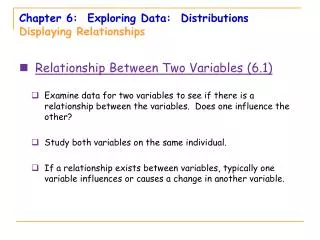
Why do we study the Normal Distribution? • Very common distribution of data throughout many disciplines. • SAT / ACT scores • Measure of diameter of tennis balls • Heights / weights of people • Once we know a distribution is Normal, there is a tremendous amount of information we can determine or predict about it.
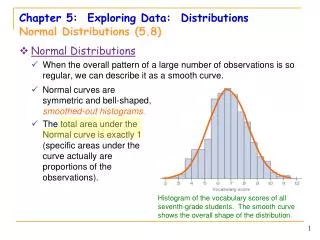
Normal Distribution • All normal distributions have the same basic shape. • The difference: tall and thin vs. short and fat • However, we could easily stretch the scale of the tall thin curve to make it identical to the short fat one. • The area under the curve can be thought of in terms of proportions or percentage of data. • The total area under the curve is 1.0 (100%)
The Standard Normal Distribution • We can standardize any normal curve to be identical. • We do this by treating the mean as Zero and the SD as One. • The variable along the x-axis becomes what we call a z score. • The z score is the number of SDs away from the mean.
Finding z scores for the Standard Normal Distribution • Practice problems: • 1) Normal distribution with: • mean = 45 and SD = 5 • Find the z score for a data value of 19 • Find the z score for a data value of 52 • 2) Normal distribution with: • Mean = 212 and SD = 24 • Find the z score for a data value of 236
Proportion of data in a range • We can use the standard normal curve to find proportion of data in a range of values. • Normal Curve example: SAT I Math scores • Mean = 500 SD = 40 • Find the proportion of data in the score range 575 or less. • Using z tables: Table A very back of book • Find the proportion of data above 575. • Find the proportion of data between 490 and 550.
Homework • Read all of 2.5. • Be prepared for quiz on Tuesday.
2.5 Quiz • You have collected data regarding the weights of boys in a local middle school. The distribution is roughly normal. The mean is 113 lbs and the SD is 10 lbs. • A) What proportion of boys are below 100 lbs? • B) What proportion are above 120 lbs? • C) What proportion are in between 90 & 120 lbs?
Using calculator for proportions • You can also use the TI-83 or higher to find these same proportions: • 2nd , Distr, normalcdf(low, high,mean,SD) • When using z scores you can leave mean,SD blank. normalcdf(low, high) it will default to mean=0 and SD=1. • This will give you the same area under the curve (proportion of data) as the z table.
Finding the z score from the Percent • If you know the percent of data covered under a normal distribution, you can find the z-score. • Simply look up the percent (proportion) in the z table and relate it to the corresponding z score. • Find the value that is closest to the percent given • Another method is with the calculator. • 2nd ,Distr, invNorm(proportion, mean, SD)
Example • Find the z-score that has the given percent of values below it in a standard normal distribution: • a) 32% b) 41% (use the z-table) • c) 87% d) 94% (use your calculator)
Using the z-score to find a value • If you know how many SDs a value is from the mean, you can use this (z-score) to find the actual data value: • x = mean + (z • SD) • Example: The mean weight of the boys at a middle school is 113 lbs, with a SD of 10 lbs. One boy is determined to be 2.2 SDs above the mean. How much did the boy weigh?
Combining the last two situations • So now, if you know the percentage of data above or below a data value and you know the mean and SD, you can figure out that data value: • Use z-table to find the z-score, then use the z score with mean and SD to find the data value. • Or you can use the invNorm function on your calc. • invNorm(proportion, mean, SD)
Example • The heights of U.S. 18-24 yr old females is roughly normally distributed with a mean of 64.8 in. and a SD of 2.5 in. • Estimate the percent of women above 5’8” • What height would a US female be if she was 1.5 SDs below the mean? Give your answer in ft & in. • What height would a US female be if she was considered to be in the 80th percentile?
Review Examples • What percentage of US females is above 5’7”? • What percent are between 5’7” and 5’0”?
Trick Question • The cars in Clunkerville have a mean age of 12 years and a SD of 8 years. What percentage of cars are more than 4 years old? • Why is this a trick question?
Homework • Page 93 • E59, 61, 63, 64, 67, 69, 71, 73, 74