Download
1 / 32
380 likes | 666 Views
A Bayesian Network Based Pipeline Risk Management. CORROSION 2012 Salt Lake City, Utah, USA. Pipeline risk assessment methodology. How to reduce the risk of pipeline failure ? Understand Risk. Pipeline risk assessment methodology.

E N D
A Bayesian Network Based Pipeline Risk Management CORROSION 2012 Salt Lake City, Utah, USA
Pipeline risk assessment methodology How to reduce the risk of pipeline failure ? Understand Risk
Pipeline risk assessment methodology Our understanding is as weak as our weakest link! Data Acquisition & Management Modeling Physics based & Probabilistic Communication Understanding results
Pipeline risk assessment methodology 1 Data Acquisition
Pipeline risk assessment methodology — Data Acquisition Data Acquisition • Building a geospatial data base • Vector: locations of roads, water bodies, farms, HCA… • Raster: soil type and pH, land coverage, earth quake, flooding, lighting strike probabilities… • Data collection automation • Remote sensing (Sensor network) • Inspection data (Silver Pipe) • External sources (hurricane, flooding predictions from USGS)
Pipeline risk assessment methodology 2 Modeling
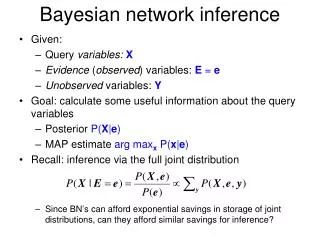
Consequence Cause Predict presence of water Model Model Historical data Predict corrosion Inspections
1 Model can be run in 2 directions! Predict presence of water Predict corrosion
If I know A, I have a better understanding of B If I know B, I have a better understanding of A
2 CORR <0.001 0.001-0.01 0.01-0.1 0.1-1 >1 mm/y P(CORR) 26% 48% 16% 1% 9% Not a number, but a probability density function
Example: It is time to evaluate the probability of failure of a pipeline: - no data where collected for the last 10 years - no failures where recorded for the last 10 years LOW RISK (no failure) HIGH RISK (no data) Maybe 50/50 It is impossible to represent this situation with only one risk value.
SOLUTION: Probability density functions are made to deal with uncertainty s Gathering information allows to improve our certainty about what the real failure probability is Low probability Medium probability We stop gathering data when sufficient accuracy is achieved, thus saving money. High probability Probability of Probability of failure Probability of failure
Pipeline risk assessment methodology — Modeling Initial Time independent Time dependent • Identify the triplet: RISK = Scenario {P × C} • Probability: • Manufacturing defects • Construction quality • Impact of the Weather • Ground Movement • Mechanical Damage • Incorrect operation • External and internal corrosion • Stress corrosion cracking • Consequence: • Financial impact • Environmental impact • Health and safety • Public outrage
Pipeline risk assessment methodology — Modeling 3rd PARTY DAMAGE
Identify a failure mode Identify key parameters having an effect on failure Create a decision tree Use past failure to “quantify strength of connections” Validation Pipeline risk assessment methodology START Unauthorized Activity ? +4 Y N Dent ? +3 Y N 3rd party damage in last 10 years? +3 Y D/t ? +1 Y N High population density? +3 Y N N DOC<3’ ? +1 Y Farm, road, river ? +2 Y N N THRID PARTY DAMAGE END SCORE Vandalism in last 10 years? +2 Y N
Identify a failure mode Identify key parameters having an effect on failure Create a decision tree Use past failure to “quantify strength of connections” Validation • Strengths: • Easy to implement • Runs fast • Capture knowledge • Weaknesses: • Binary model, each input must be known and have a single value • What if I do not know the population density? • What if there is a 50% probability of having a farm? • Model is static (it does not learn from it’s mistakes) • Currently used by DNV for the industry
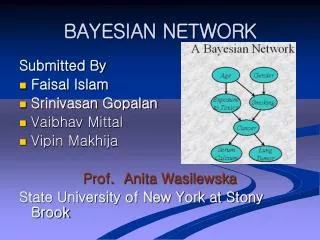
Identify a failure mode Identify key parameters having an effect on failure Link key parameters by cause-consequence relationship Quantify the strength of connections Validation Bayesian Approach to Pipeline risk assessment Exposed Pipe Farm Evidence Farm Probability Farming incident Road Evidence Road Probability Collision with Car Collision Collision Water Way Evidence Water Way Probability Collision with Boat Construction Zone Evidence It happened! Construction Zone Probability Construction Zone 3rd party damage Unauthorized Activity Evidence Wrong Operation Unauthorized Activity Probability S Population Density Evidence Vandalism Population Density
Identify a failure mode Identify key parameters having an effect on failure Link key parameters by cause-consequence relationship Quantify the strength of connections Validation • Strengths: • Each parameter is represented by a function Ex: “There is 99% chance that there is a farm and 1% chance that there is no farm” • Model works well under uncertainty Ex: 50% chance of 3PD is very different from the statement “I do not know”. • Model has a physical meaning (cause consequence relationships) Failure mechanism is known • Model can learn from it’s mistakes (learning algorithms) • Model can run in 2 directions! Find the most probable cause / run sensitivity analysis • Weaknesses: • Math is not trivial, need of a specialized software
Pipeline risk assessment methodology — Modeling DRY GAS ICDA FLOW MODEL PIPELINE INCLINATION CRITICAL INCLINATION WATER ENTRAINEMENT
Pipeline risk assessment methodology — Modeling Time ? FLOW MODEL PIPELINE INCLANATION CRITICAL INCLINATION WATER ENTRAINEMENT
Pipeline risk assessment methodology — Modeling Time ? FLOW MODEL Location? Can water be entrained if water isn’t coming? PIPELINE INCLANATION CRITICAL INCLINATION WATER ENTRAINEMENT Corrosivity of Water
Pipeline risk assessment methodology 3 Communication
Pipeline risk assessment methodology — Communication Past Static reports Present Dynamic risk assessment on a local computer Future Consequence of an action can be seen in real time. Risk assessment is performed by remote computers