Download
1 / 22
230 likes | 412 Views
Introduction to Statistics Engr. Dr . Attaullah Shah. Some quotes about Statistics. A statistical analysis, properly conducted, is a delicate dissection of uncertainties, a surgery of suppositions. ~M.J. Moroney

E N D
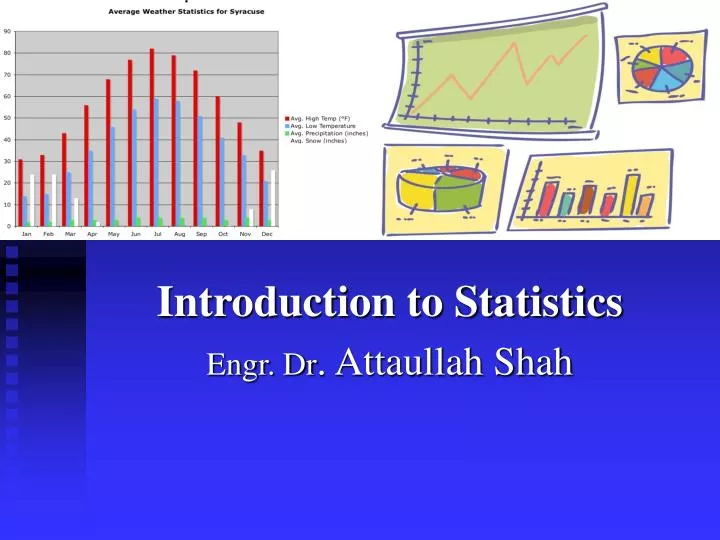
Introduction to Statistics Engr. Dr. Attaullah Shah
Some quotes about Statistics • A statistical analysis, properly conducted, is a delicate dissection of uncertainties, a surgery of suppositions. ~M.J. Moroney • Do not put your faith in what statistics say until you have carefully considered what they do not say. ~William W. Watt. • Statistics may be defined as "a body of methods for making wise decisions in the face of uncertainty." ~W.A. Wallis • The theory of probabilities is at bottom nothing but common sense reduced to calculus. ~Laplace. • Statistics can be made to prove anything - even the truth. -Unknown • Definition of Statistics: The science of producing unreliable facts from reliable figures. Evan Esar
What is Statistics • Derived from the Latin for “state” - governmental data collection and analysis • Study of data branch of mathematics dealing with numerical facts i.e. data. • The science of Statecraftconcerning the collection and use of data by State. • The mathematical science of making decisions and drawing conclusions from data in situations of uncertainty. • Statistics is the science of the collection, organization, and interpretation of data • Statistics is the science of data. This involves collecting, classifying, summarizing, organizing, analyzing, and interpreting numerical information. • Must not be confused with word “ Statistic” referring to quantity such median, mean etc. .
Types of Statistical Applications • Descriptive Statistics: • Inferential Statistics.
Descriptive Statistics • Is the science of describing data to facilitate its understanding. • It uses both numerical and graphical methods. • Goal is to recognize trends, summarize data, and to present information in a comprehensive way. • Examples: Mean, Mode, Variance, Standard Deviation etc.
Inferential Statistics • Is the science of drawing conclusions from data. • It utilizes a sample data to make inferences to a larger population. • Inference refers to estimates, decisions, and predictions about the population. • Examples: testing of hypothesis, Regression analysis, correlation, prediction, estimation etc.
Key Terms • Population: a set of units that we are interested in studying. • Variable: a characteristic of an individual population unit. • Sample: a subset of the units of a population. • Statistical inference: estimate, or prediction of the population based on information contained in the sample.
Population Sample City 500 households
Four Elements of Descriptive Statistics • 1. The population or sample of interest • 2. One or more variables to be investigated • 3. Tables, graphics, or numerical summary tools • 4. Identification of patterns in data
Five Elements of Inferential Statistics 1. The population of interest 2. One or more variables to be investigated 3. The sample of population units 4. The inference about the population based on information contained in the sample 5. A measure of reliability for the inference
Five Different Types of Statistical Analysis • Descriptive analysis – data distribution • Inferential analysis – hypothesis testing • Differences analysis – hypothesis testing • Association analysis – correlation • Predictive analysis – regression
Environmental Statistics • Environmental statistics is the application of statistical methods to environmental science. • It covers procedures for dealing with questions concerning both the natural environment in its un-disturbed state and the interaction of humanity with the environment. • Thus weather, climate, air and water quality are included, as are studies of plant and animal populations. • All types of study involve sampling over time and space, and it is important that sampling designs be cost effective, reliable, consistent, easily manageable and , if necessary, that they can be justified in a court of law.
Three major situations of interest for us: • Baseline studies to document the present state of an environment to provide background in case of unknown changes in the future; • What can be the potential changes in the Ambient Air Quality (AAQ) due to new cement factory in an area. • What is the present distribution of heavy metal in the surface water of Islamabad? ( If any) • Targeted studies to describe the likely impact of changes being planned or of accidental occurrences; • To predict the impact of pollen concentration on the health of asthmatic patients in Islamabad. • The impact on human health due accidental toxic releases from fertilizer factory. • Regular monitoring to attempt to detect changes in the environment. • Data collection and monitoring & evaluation of air pollution due to construction activities and its comparison with NEQS.
Case Study: Acid Rain in Norway To assess the widespread concern about acid rains, regional survey of small lakes were carried out for pH, sulfate concentration, nitrate concentration, and calcium concentration at each sampled lakes. The main questions of interest are: • Is there any evidence of trends or abrupt changes in the values for one or more of the four measured chemistry variables? • If trends or changes exist, are they related for the four variables, and are they of the type that can be expected to result from acid precipitation? • Is there evidence of spatial correlation such that measurements on lakes that are in close proximity tend to be similar? • Is there evidence of time correlation such that the measurements on a lake tend to be similar if they are close in time? • We may use the correlation and Time Series analysis for such study.
EXAMPLE: Pollution at an oil refinery Environmental Protection Agency (EPA) has accused Shell Oil Company of violation environmental regulations at its refinery located in Huston during the year 2001. The regulations state that the average petroleum leaked into the ground at the refinery must not exceed 100 gallons per day during any calendar year. Fine for violating the regulations is $1,000,000. EPA regulators visited the refinery on eight days in December, 2001 and measured the petroleum leaked in gallons as 110,96,104,101,87,99,116,108.
EXAMPLE: Pollution at an oil refinery The Six Step Inference Process: • Question: Does average leakage exceed 100 gallons per day? • Population: Every single day of that year 2001. • Sample: Measurements on those 8 days in December. • Variable: Leakage in gallons. • Summary: Average leakage=102.625 gallon/day. • Inference: The average leakage for the year 2001exceeds 100 gallons. The company should be fined.
EXAMPLE: Pollution at an oil refinery Follow-up questions: • Is the sample representative of the population? • What argument might Shell use to contend that the EPA's conclusions are unreliable? • What could EPA administrators do to improve the statistical techniques?
Evolution of environment statistics • Compared to economic and social statistics a relatively new field • Frameworks and standards are evolving developing nationally and internationally • Have build up knowledge and can more clearly define information needs • The field is maturing and some hard monitoring and measurement issues are being addressed
Recommended Book: • Statistics for Environmental Science and ManagementBryan F.J. Manly
The Role of Statistics in Critical Thinking • H.G. Wells wrote: Statistical thinking will one day become as important in society as as the ability to read and write • Why? • How related to critical thinking? • How important for society? • Find article!
Exercise 1 ( Case study Exxon Valdez oil spill) Despite the large amounts of money spent on them, the studies on the effects of the Exxon Valdez oil spill on the coastal habitat of Alaska all failed to produce simple, easily understood estimates of these effects. What happened was that the oil spill took everyone by surprise, and none of the groups involved (state and federal agencies and Exxon) apparently was able to quickly produce a good sampling design and start collecting data. Instead, it seems that there were many committee meetings, but very little actually done while the short Alaskan summer was disappearing. With the benefit of hindsight, what do you think would have been a good approach to use for estimating the effects of the oil spill? This question is not asking for technical details—just a broad suggestion for how a study might have been designed.