Download
1 / 7
70 likes | 181 Views
At this time we do not have any sort of data to place in our conclusion block.

E N D
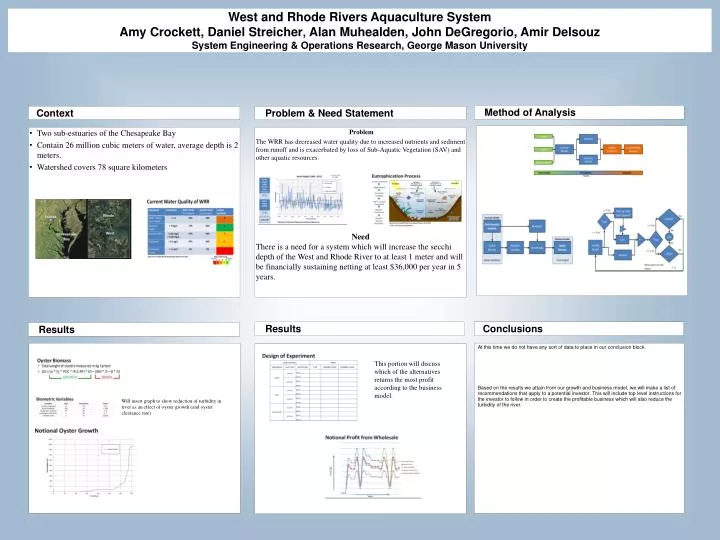
At this time we do not have any sort of data to place in our conclusion block. Based on the results we attain from our growth and business model, we will make a list of recommendations that apply to a potential investor. This will include top level instructions for the investor to follow in order to create the profitable business which will also reduce the turbidity of the river. West and Rhode Rivers Aquaculture System Amy Crockett, Daniel Streicher, Alan Muhealden, John DeGregorio, Amir Delsouz System Engineering & Operations Research, George Mason University Method of Analysis Context Problem & Need Statement Problem The WRR has decreased water quality due to increased nutrients and sediment from runoff and is exacerbated by loss of Sub-Aquatic Vegetation (SAV) and other aquatic resources. Need There is a need for a system which will increase the secchi depth of the West and Rhode River to at least 1 meter and will be financially sustaining netting at least $36,000 per year in 5 years. • Two sub-estuaries of the Chesapeake Bay • Contain 26 million cubic meters of water, average depth is 2 meters. • Watershed covers 78 square kilometers Conclusions Results Results This portion will discuss which of the alternatives returns the most profit according to the business model. Will insert graph to show reduction of turbidity in river as an effect of oyster growth (and oyster clearance rate)
CONTEXT • Two sub-estuaries of the Chesapeake Bay • Contain 26 million cubic meters of water, average depth is 2 meters. • Watershed covers 78 square kilometers
Problem The WRR has decreased water quality due to increased nutrients and sediment from runoff and is exacerbated by loss of Sub-Aquatic Vegetation (SAV) and other aquatic resources. Need There is a need for a system which will increase the secchi depth of the West and Rhode River to at least 1 meter and will be financially sustaining netting at least $36,000 per year in 5 years.
RESULTS 1 Will insert graph to show reduction of turbidity in river as an effect of oyster growth (and oyster clearance rate)
Conclusions & Future Work • A list of recommendations will be compiled based on growth and business model output