Download
1 / 35
350 likes | 464 Views
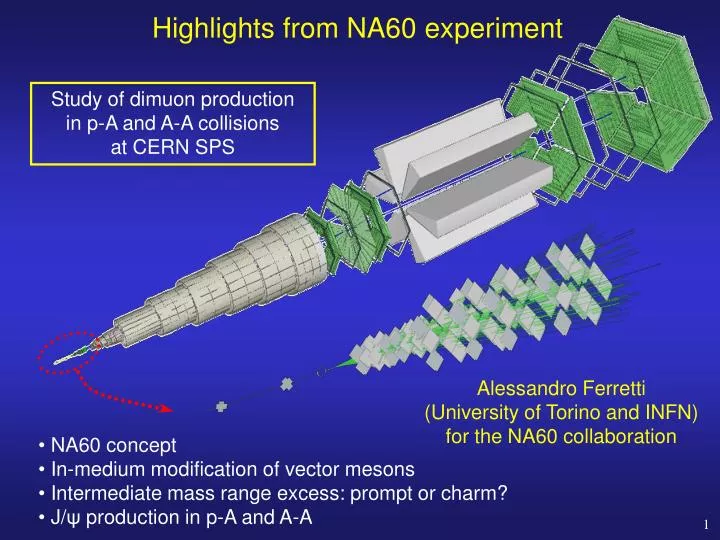
m. m. Highlights from NA60 experiment. Study of dimuon production in p-A and A-A collisions at CERN SPS. Alessandro Ferretti (University of Torino and INFN) for the NA60 collaboration. NA60 concept In-medium modification of vector mesons

E N D
m m Highlights from NA60 experiment Study of dimuon production in p-A and A-A collisions at CERN SPS Alessandro Ferretti (University of Torino and INFN) for the NA60 collaboration • NA60 concept • In-medium modification of vector mesons • Intermediate mass range excess: prompt or charm? • J/ψ production in p-A and A-A
prompt or ! displaced hadron absorber Muon Other Layout of the NA60 experiment Muon trigger and tracking: 2.5 T dipole magnet NA10/38/50 spectrometer beam tracker vertex tracker NA60 concept: place aradiation-hard silicon tracking telescopein the vertex region to measure the muon tracksbeforethey suffer multiple scattering in the absorber andmatchthem to the tracks measured in the muon spectrometer. • Origin of muons can be accurately determined • Mass resolution @ :~20 MeV/c2 (vs. 80 MeV/c2) • Mass resolution @ J/:~70 MeV/c2 (vs. 105 MeV/c2) Iron wall magnetic field targets ZDC Matching in coordinate and momentum space!
Low dimuon masses – In-In data f Search for in-medium modifications of vector mesons Peripheral data: well reproduced by the hadronic cocktail Central data: isolate the excess by subtracting the cocktail Phys. Rev. Lett. 96 (2006) 162302 and: fix yields such as to get, after subtraction, a smooth underlying continuum : =set upper limit, defined by saturating the measured yield in the mass region close to 0.2GeV(lower limit for excess). =use yield measured for pT > 1.4 GeV/c (where the excess is small)
Excess spectra from difference Fine analysis in 12 centrality bins data – cocktail (all pT) • No cocktail rand no DD subtracted • Clear excessabove the cocktail ,centered at the nominal r poleand rising with centrality • Excess even more pronounced at low pT cocktail / =1.2
Evolution of the excess shape as a function of centrality Quantify the peak and the broad symmetric continuum with a mass interval C around the peak (0.64 <M<0.84 GeV) and two equal bins L, U on either side “continuum” = 3/2(L+U) “peak” = C-1/2(L+U) Fine analysis in 12 centrality bins continuum/r Peak/cocktail r drops by a factor 2 from peripheral to central: the peak is not simply the cocktail r residing over a broad continuum. peak/r nontrivial changes of all three variables at dNch/dy>100? peak/continuum
Comparison to theory • Predictions for In-In by Rapp et al. (2003) for<dNch/d> = 133, covering all scenarios • Data and predictions as shown, after acceptance filtering, roughly mirror the respectivespectral functions, averaged over space-time and momenta • Theoretical yields normalized to data in mass interval < 0.9 GeV/c2 Only broadening of (RW) No mass shift (BR) observed
Description of the mass region above 1 GeV Rapp / Hees, hep-ph/0604269 (2006) Ruppert / Renk, Phys.Rev.C (2005) Mass region above 1 GeV described in terms of hadronic processes, 4 p …, sensitive to vector-axialvector mixing and therefore to chiral symmetry restoration Mass region above 1 GeV described in terms of partonic processes, dominated by q-qbar annihilation Hadron-parton duality?
First look at transverse momentum distributions • Differentialfits with gliding windows of pT=0.8 GeV local slope Teff • At high pT, -like region hardest, high mass region softest! • Not yet explained by theory • Weak centrality dependence • Trend at small mTdifferent to what expected from radial flow (not for f!) • High mass interval shows steepest slope smaller T slope
Conclusions I (low dimuon masses) Mass spectra • Pion annihilation seems to be a major contributor to the lepton pair excess at SPS energies • Strong broadening, but no significant mass shift of the r pT spectra • Strong mass dependence of pT spectra • Spectra behave opposite to expected from radial flow • pT spectra could serve as a handle to disentangle partonic from hadronic sources (breaking parton-hadron duality)
Intermediate dimuon masses (IMR – 1.1<mmm<2.5 GeV) Observed IMR excess in In-In over expected Charm and Drell-Yan yields. Where it comes from? NA60 measures the muon offsets Dm: distance between interaction vertex and track impact point Dimuon offset Fix promptcontribution to the expected DY– leave open charm free Leave DY free and fix open charm according to expectations Good Fit Bad Fit The excess is a prompt source ~2 times higher than the expected DY yield
All data preliminary Corrected for acceptance Centrality dependence of the excess Slight increase as a function of number of participants with respect to Drell-Yan
Mass spectrum (1.16<M<2.56 GeV/c2) Contributions to IMR corrected for the acceptance in -0.5 < cos < 0.5 2.92 < ylab < 3.92 (both 4000 and 6500 A data sample used) preliminary
No acceptance correction 6500 A Corrected for acceptance Corrected for acceptance pT dependence of the excess (1.16<M<2.56 GeV/c2) High pT tail strongly depends on the correctness of Drell-Yan description by PythiaTeff fits are performed in 0< pT <2.5 GeV/c preliminary
Towards a “unification” of low and intermediate dimuon mass regions: evolution of excess Teff vs. Mmm preliminary
Conclusions II (intermediate mass range) • Prompt dimuons production is~2 times higher than the expected Drell-Yan in Indium-Indium collisions at 1.16 < m < 2.56 GeV/c2. • Charm production is compatible with expectations. • Prompts/Drell-Yan slightly increases with number of participants. • Excess contribution is dominated by low pT’s, reaching a factor 3.50.4 for pT<0.5 GeV/c. • The effective temperature of the excess (~190 MeV) is considerably lower than the temperatures observed at lower masses (both for the resonances and the low-mass excess) Results are preliminary, since they depend on the correctness of used Drell-Yan and Charm contribution pT distributions. Need to be verified with pA data
Direct J/ sample – In-In data The measured J/ vs. EZDC distribution is compared to the distribution expected in case of pure nuclear absorption. Normalization of the nuclear absorption curve: the ratio measured/expected, integrated over centrality, is fixed to the one resulting from J/ψ/DY analysis (0.87 ± 0.05).
(J/)/DY = 29.2 2.3 L = 3.4 fm Preliminary! (J/)/DY in p-A collisions at 158 GeV • Preliminary NA60 result shows that the rescaling of the J/ • production cross section from 450(400) GeV to 158 GeV is correct! • Next step: obtain absJ/ at 158 GeV
0.5 < pT < 5 GeV 0.1 < yCM < 0.6 0 < pT < 5 GeV 0.4 < yCM < 0.75 H = 0.03 0.06 CS = -0.03 0.17 2/ndf =1.42 2/ndf =1.01 J/ polarization • Quarkonium polarization test of production models • Color Singlet Model: transverse polarization • Color Evaporation Model: no polarization • Non-Relativistic QCD: transverse polarization at high pT • Deconfinement should lead to a higher degree of polarization • (Ioffe,Kharzeev PRC 68(2003) 094013)
pT2 vs centrality • If pT broadening is due to gluon scattering in the initial state • pT2 = pT2pp + gN · L • NA60 In-In points are in fair • agreement with Pb-Pb results • We get gNInIn = 0.067 0.011 (GeV/c)2/fm pT2ppInIn = 1.15 0.07 (GeV/c)2 2/ndf = 0.62 to be compared with gNPbPb = 0.073 0.005 (GeV/c)2/fm pT2ppPbPb = 1.19 0.04 (GeV/c)2 2/ndf = 1.22 (NA50 2000 event sample) pT broadening consistent with initial state gluon scattering
Preliminary! ’ suppression in In-In and pA collisions • Study limited by statistics in In-In (N’~ 300) • Normalized to Drell-Yan yields In-In: • Most peripheral point • (Npart ~ 60) does not show • an anomalous suppression • Good agreement with • Pb-Pb results pA: Also the ’ value measured by NA60 at 158 GeV is in good agreement with the normal absorption pattern, calculated from 450 (400) GeV data
Conclusions III (J/ψ suppression) • NA60 has performed a high-quality study of J/ production in In-In collisions at the SPS which confirms, for a much lighter system, the anomalous suppression seen in Pb-Pb collisions by NA50 • Preliminary results from p-A collisions at 158 GeV show that the normalization of the absorption curve is correct • Peripheral In-In and Pb-Pb results are compatible with p-A • Absence of J/ polarization in the kinematical window probed by NA60 • pT distributions sensitive to initial state effects • Study of J/ suppression for other collision systems, with the accuracy • allowed by a vertex spectrometer, would be very interesting
CERN Heidelberg Bern Palaiseau BNL Riken Yerevan Stony Brook Torino Lisbon Cagliari Clermont Lyon The NA60 collaboration http://cern.ch/na60 ~ 60 people 13 institutes8 countries R. Arnaldi, R. Averbeck, K. Banicz, K. Borer, J. Buytaert, J. Castor, B. Chaurand, W. Chen, B. Cheynis, C. Cicalò, A. Colla, P. Cortese, S. Damjanović, A. David, A. de Falco, N. de Marco, A. Devaux, A. Drees, L. Ducroux, H. En’yo, A. Ferretti, M. Floris, P. Force, A. Grigoryan, J.Y. Grossiord, N. Guettet, A. Guichard, H. Gulkanyan, J. Heuser, M. Keil, L. Kluberg, Z. Li, C. Lourenço, J. Lozano, F. Manso, P. Martins, A. Masoni, A. Neves, H. Ohnishi, C. Oppedisano, P. Parracho, P. Pillot, T. Poghosyan, G. Puddu, E. Radermacher, P. Ramalhete, P. Rosinsky, E. Scomparin, J. Seixas, S. Serci, R. Shahoyan, P. Sonderegger, H.J. Specht, R. Tieulent, E. Tveiten, G. Usai, H. Vardanyan, R. Veenhof and H. Wöhri
J/ / DY analysis Set A (lower ACM current) Set B (higher ACM current) • Combinatorial background (, K decays) from event mixing method (negligible) • Multi-step fit: • a) DY (M>4.2 GeV), b) IMR (2.2<M<2.5 GeV), c) charmonia (2.9<M<4.2 GeV) • Mass shape of signal processes from MC (PYTHIA+GRV94LO pdf) • Results from set A and B statistically compatible use their average in the following • Stability of the J/ / DY ratio: • Change of input distributions in MC calculation 0.3% (cos), 1% (rapidity) • Tuning of quality cut for muon spectrometer tracks < 3%
Meas/Exp 1 A1 A2 Npart Step position Smooth effect or sharp drop ? Step position: Npart = 86 ± 8 ( Bj ~ 1.6 GeV/fm3 ) A1= 0.98 ± 0.02 A2= 0.84 ± 0.01 2/dof = 0.7 • Taking into account the EZDC resolution • data are compatible with a sharp drop • An onset smoother than our resolution on Npart (~20) is disfavored • Work in progress to extend our Npart range towards more peripheral events
T vs centrality Fitting functions • Used by NA50 • Gives slightly • higher T values (~ 7 MeV) 1) dN/dpT = pT mT K1(mT/T) 2) dN/dpT = pT e -mT/T
Comparison with recent results (HERA-B, E866) Helicity Collins Soper Helicity • HERA-B, in p-A collisions at 920 GeV, sees (mostly in the • Collins-Soper reference system) a significant • longitudinal polarization at low pT (P. Faccioli et al.,Hard Probes 2006) • No polarization in NA60, which covers a higher xF region • E866, at still larger xF, sees a (slight) transverse polarization • (T.H. Chang et al., PRL 91(2003), 211801)
Azimuthal distribution of the J/ central peripheral More peripheral data hint for a non isotropic emission pattern? Only 50% of the statistics analyzed
Event selection • 2 event selections have been used for J/ analysis • 1) • No matching required • Extrapolation of muon tracks must lie in the target region • Higher statistics • Poor vertex resolution (~1 cm) • 2) • Matching between muon tracks and vertex spectrometer tracks • Dimuon vertex in the most upstream interaction vertex • (MC correction to account for centrality bias due to fragment reinteraction) • Better control of systematics • Good vertex resolution (~200 m) • Lose 40% of the statistics • After quality cuts NJ/ ~ 45000 (1), 29000 (2) • 2 analyses • a) Use selection 1 and normalize to Drell-Yan • b) Use selection 2 and normalize to calculated J/ nuclear absorption
Viewed from J/ rest frame -0.1<cosH<0 y + CS x pproj z ptarg z + x J/ H pproj ptarg y J/ kinematical distributions • Study of differential distributions important in order to assess • Role of initial state effects pT distributions • Production mechanisms and/or deconfinement polarization • Technique • 3-D acceptance correction (pT, y, cos) • Fine binning (0.1 GeV/c pT, 0.05 y-units, 0.1 cos-units) • Define fiducial region (zone with local acceptance >1%) Collins Soper Frames for polarization studies Helicity
Low mass dimuons • Net data sample: 360 000events • Fakes / CB< 10 % • ω and peaks clearly visible in dilepton channel; even μμ seen • Mass resolution:23 MeVat the position • Progress over CERES: statistics: factor >1000resolution: factor 2-3 ω
Role of baryons Calculations for In-In by Rapp et al. (11/2005) for <dNch/d> = 140 • Improved model: • Fireball dynamics • 4 processes • spectrum described in absolute terms Baryons important in the low mass tail
pT spectra - acceptance correction • Reduce 3-dimensional acceptance correction inM-pT-y to a 2-dimensional correction inM-pT, using measuredydistribution as an input.Use for control • Use slices of m = 0.1 GeV pT = 0.2 GeV • Check behaviour on 3 extended mass windows Subtract charm from the data (based on NA60 IMR results) before acceptance correction
Systematics of low-pT data: combinatorial background • Enhanced yield at low-pT seen at all centralities,including the peripheral bin • Errors at low pT, due to subtraction of combinatorial background: peripheral 1% semiperipheral 10% semicentral 20% central 25% Enhanced yield at low pT not due to incorrect subtraction of combinatorial background
Excess pT spectra: 3 centrality bins Hardly any centrality dependence BUT Significant mass dependence