Download
1 / 29
290 likes | 395 Views
Alternative Ways of Presenting Historical Census Data. Luuk Schreven & Anouk de Rijk luuk.schreven@niwi.knaw.nl & anouk.de.rijk@dans.knaw.nl Netherlands Institute for Scientific Information Services. Structure of presentation. Introduction & objectives Dissemination & publication Nesstar

E N D
Alternative Ways of Presenting Historical Census Data Luuk Schreven & Anouk de Rijk luuk.schreven@niwi.knaw.nl & anouk.de.rijk@dans.knaw.nl Netherlands Institute for Scientific Information Services
Structure of presentation • Introduction & objectives • Dissemination & publication • Nesstar • Source oriented vs. usability/ flexibility • Excel-Cannibal™ data extraction • Conclusions
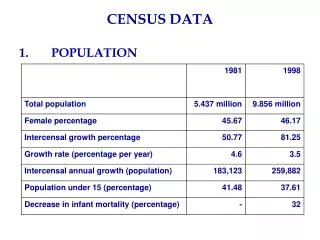
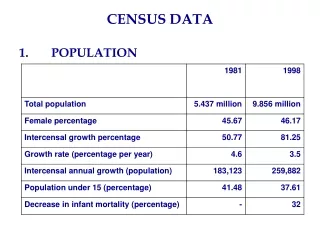
Introduction to census project • 1997 - 1999: • Scanning 200 books, 42.500 pages • Data-entry aggregate census data 1899 • 2002 - March 2004: • Validation and correction of aggregate census data 1795-1859 and 1930 • archiving digital census microdata 1960 and 1971 • March 2003 – July 2006: • Life Courses in Context (see: http://www.lifecoursesincontext.nl) • Data-entry of aggregate census data 1869-1956 • Documentation, harmonization, access and research
Introduction II • Main objective: • Source accurate digital copies of aggregate census tables 1795 – 1971 • Partners: • Statistics Netherlands • International Institute for Social History • Historical Databank of Dutch Municipalities • University of Nijmegen
What has been realized? • (restricted) Access to original micro data files for 1960 and 1971 census • New English website up and running • www.dutchcensusdata.nl • 40.000 pages of aggregate census data • Documentation is available
Data dissemination • Pilot investigation • Beyond 20/20 • Publication seems easy • Commercial software • Statistics Netherlands’ StatLine • Publication difficult, mostly through bureaucratic bumps • Software only available at Statistics Netherlands • Nesstar • Encouraging results & knowledge at Steinmetz-archive • Software available • Conclusion: extended testing Nesstar
What is NESSTAR? • Data publishing and analysistool • Supports micro-data as well as aggregated data • A published dataset can contain data, metadata and additional information
Cubes • Multidimensional tables consisting of dimension variables and measure variables • Dimensions can be hierarchical • Allows the user to arrange the data display online • Option to map the data and visualize the data in graphs
Conclusion of pilot study • Alternative dissemination through Nesstar: • less focus on historical accuracy • more focus on usability and flexibility • not feasible within the time-limit of the current project
Lessons • When digitizing a source: be source accurate • When usability of the data is your concern: strive for flexibility • Flexibility & complex multidimensional tables aren’t easily compatible…
Excel-cannibal™ • Idea: every Excel tables is an accumulation of facts • Objective: direct access to the data and direct access to all components a fact is based on • Solution: Database containing both data and metadata based on smallest data component in Excel tables
Back-end vs. Front-end • Excel-Cannibal™ will build the back-end database • Front-end: structured search & retrieval options • Output: data tables & GIS • Applying for funding this fall
Questions? • Url: www.dutchcensusdata.nl • E-mail: luuk.schreven@niwi.knaw.nl or anouk.de.rijk@dans.knaw.nl