Download
1 / 28
280 likes | 423 Views
MANITOBA CENTRE FOR HEALTH POLICY. The Manitoba RHA Indicators Atlas: Population-based comparisons of health and health care use MCHP’s 10th annual Rural and Northern Health Care Day: October 7, 2003. Manitoba Centre for Health Policy. Authors of the report:

E N D
MANITOBA CENTRE FOR HEALTH POLICY The Manitoba RHA Indicators Atlas: Population-based comparisons of health and health care use MCHP’s 10th annual Rural and Northern Health Care Day: October 7, 2003
Manitoba Centre for Health Policy Authors of the report: Principal Investigator: Patricia J. Martens PhD co-investigators: Randy Fransoo, The Need To Know Team, Elaine Burland, Laurel Jebamani, Charles Burchill, Charlyn Black, Natalia Dik, Leonard MacWilliam, Shelley Derksen, Randy Walld, Carmen Steinbach, Matt Dahl
Heterogeneity evident throughout the province amongst aggregate areas (North, Winnipeg, Brandon, Rural South) amongst RHAs amongst districts within each RHA useful as one aspect of the Community Health Assessment process Key findings
districts defined by the RHAs, refined by MCPH/Manitoba Health for geo-coding health indicators (RHA 1999 report) reviewed and revised by NTK Team a longitudinal “look” (approximately 1991-1995, 1996-2000 depending on indicator) no matter where a person received a service, the use is attributed back to the region of residence The Need To Know Research Project #1: RHA Indicators Atlas
Non-Winnipeg RHAs and districts used in this report (Figures 1.1, 1.2, 1.3)
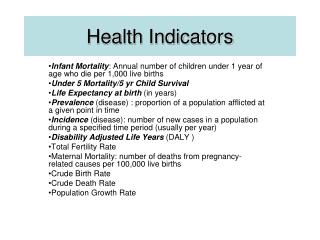
How do I interpret these numbers? Chapter 2, plus examples in each chapter Who lives in my region? (age, sex, SES) Chapter 3 What is their overall health status? Chapter 4 - global health status measures Chapter 5 - selected illnesses Chapter 7 - selected child health measures The foundation of the report
What are their patterns of health care use? Chapter 6 - preventive care Chapter 8 - physician services Chapter 9 - hospital services Chapter 10 - surgical and diagnostic services Chapter 11 - home care and PCH Chapter 12 - pharmaceutical use The foundation of the report
1991-1995 1996-2000 Mb Avg 91-95 Mb Avg 96-00 PMR 1996-2000 North Eastman is 3.67 (higher than MB at 3.32) Figure 4.2.1: Premature Mortality Rates by RHA Age- & sex-adjusted rate of deaths per 1000 aged 0-74 South Eastman (1,2) South Westman (1) Brandon (1) Central (1,2,t) Marquette Parkland Interlake (1,t) North Eastman (2) Burntwood (1,2) Churchill (1,t) Nor-Man (1,2,t) Rural South (t) North (1,2,t) Winnipeg (t) Manitoba (t) 0 1 2 3 4 5 6 7 8 9 '1' indicates area's rate was statistically different from Manitoba average in first time period shown '2' indicates area's rate was statistically different from Manitoba average in second time period shown 't' indicates change over time was statistically significant
average PMR 1996-2000 Springfield 2.68 higher Winnipeg River 3.08 Brokenhead 3.68 Iron Rose 3.38 Blue Water (2) 4.33 Northern Remote (1,2) 8.53 From the RHA to the district levels PMR 1996-2000 North Eastman (2) 3.67
“t” = South Eastman earlier rate (shown in grey) is statistically different (lower) than the South Eastman later rate (shown in black). “1” = South Eastman rate (shown in grey) for the early time period is statistically different (lower) than the Manitoba overall average rate for the early time period (shown as a grey vertical line on the graph). “2” = South Eastman rate (shown in black) for the later time period is statistically different (lower) than the Manitoba overall average rate for the later time period (shown as a black vertical line on the graph) South Eastman (1,2,t)
YIKES - give me another way to understand statistical significance
Confidence Intervals for PMR By RHA, 1991/92-1995/96 • South Eastman • South Westman • Brandon • Central • Marquette • Parkland • Winnipeg • North Eastman • Interlake • Burntwood • Norman • Churchill • Manitoba 0 1 2 3 4 5 6 7 Adjusted Death per 1000, ages 0-74 years
* * * * * Confidence Intervals for PMR By RHA, 1991/92-1995/96 • South Eastman • South Westman • Brandon • Central • Marquette • Parkland • Winnipeg • North Eastman • Interlake • Burntwood • Norman • Churchill • Manitoba 0 1 2 3 4 5 6 7 S= statistically significant from Manitoba Adjusted Death per 1000, ages 0-74 years
Rates are age- and sex-adjusted to Manitoba 1996 population structure, with crude rates and annual numbers given in appendices stroke rate for Burntwood crude rate is 1.52 per thousand age/sex adjusted rate is 3.2 per thousand! Rates
Figure 3.3.9a: Age Profile of Burntwood, 2000 Population: 45,051 90 + Burntwood 2000 80-84 Manitoba 2000 70-74 Females Males 60-64 50-54 40-44 30-34 20-24 10-14 0-4 7% 6% 5% 4% 3% 2% 1% 0% 1% 2% 3% 4% 5% 6% 7%
Each graph shows the rates by RHA/district see the executive summary for overall rate comparisons many “comparisons” your RHA and districts within the RHA to the Manitoba rate your aggregate area rate (North, Rural South, Brandon, Winnipeg) Rates
“North” “Rural South” omitting Brandon and Winnipeg Churchill Manitoba’s RHAs (up to July 1, 2002) Burntwood Nor-Man North Parkland Eastman Interlake Marquette Winnipeg Brandon South Eastman South Westman Central
Rural South rate = 0.54 MB rate = 0.49
Incidence mortality cure Incidence & Prevalence Prevalence
Open homecare cases 16.1 around 1995 21.0 around 2000
New home care cases 8.0 Closed 6.8 Incidence & Prevalence Home Care Cases (p.196+) 1995 Open home care cases 16.1 Expect an increase in the “prevalence”, ie, open cases
Top causes of death (page 66) Top diagnoses for physician visits (page 142) top causes of hospitalization (page 165) physician visit rates by age and gender (page 132) And now to just a few of my favourite … graphs!
The need to “drill deeper” to find interesting exceptions the North: lower consult rates Churchill: highest consult rates in the province Heterogeneity within areas Thompson airport
is your RHA missing data? Look into it! Heterogeneity evident throughout the province look for the “stories” in the data useful as one aspect of the Community Health Assessment process Key findings
www.umanitoba.ca/centres/mchp/ M Manitoba Centrefor Health Policy C H P go to Reports, or to Data Extras
Chapter 4:Health status and mortality Chapter 5:The burden of illness Chapter 6:Preventive care measures Chapter 7:Child health indicators Chapter 8:Physician services Chapter 9:Hospital services Chapter 10: Surgical procedures Chapter 11:Home Care and PCH Chapter 12:Pharmaceutical use Chapter links