Download
1 / 123
1.23k likes | 1.43k Views
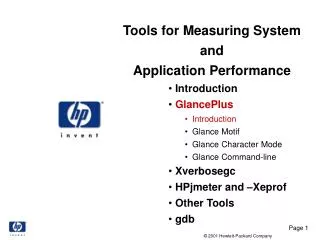
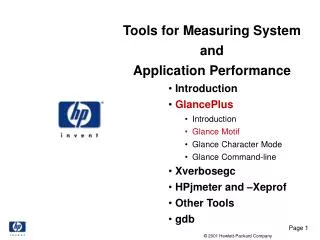
Tools for Measuring System and Application Performance. Introduction GlancePlus Introduction Glance Motif Glance Character Mode Glance Command-line Xverbosegc HPjmeter and –Xeprof Other Tools. HPjmeter Understanding Your Java Application’s Performance.

E N D
Tools for Measuring System and Application Performance • Introduction • GlancePlus • Introduction • Glance Motif • Glance Character Mode • Glance Command-line • Xverbosegc • HPjmeter and –Xeprof • Other Tools
HPjmeter Understanding Your Java Application’s Performance
HPjmeterFree and Easy to Use • Analyzes Java application performance • Graphical • Free • Runs on any platform • http://www.hpjmeter.com/
HPjmeterHow To Collect Metrics JVMPI Java 1.2.1-A and compatible Java 1.3.0-C and compatible java.hprof.txt JVMPI+ (HP-UX) Java 1.1.8+ Java 1.2.2.05+ Java 1.3.x HPjmeter java.eprof 1.1 Java 1.1.x java.prof
HPjmeterJVMPI Options Options to use to any JVM: cpu=samples,thread=y,depth=10,cutoff=0,format=a heap=all,cpu=samples,thread=y,depth=10,cutoff=0,format=a monitor=y,cpu=samples,thread=y,depth=10,cutoff=0,format=a A support matrix for the features you need is online and in Help
HPjmeterJVMPI - Xrunhprof hprof usage: -Xrunhprof[:help]|[<option>=<value>, ...] Option Name/Value Description Default --------------------- ----------- ------- heap=dump|sites|all heap profiling all cpu=samples|times|old CPU usage off monitor=y|n monitor contention n format=a|b ascii or binary output a file=<file> write data to file java.hprof(.txt) net=<host>:<port> send data over a socket write to file
HPjmeterJVMPI - Xrunhprof hprof usage: -Xrunhprof[:help]|[<option>=<value>, ...] Option Name and Value Description Default --------------------- ----------- ------- depth=<size> stack trace depth 4 cutoff=<value> output cutoff point 0.0001 lineno=y|n line number in traces? y thread=y|n thread in traces? n doe=y|n dump on exit? y Example: java -Xrunhprof:cpu=samples,file=log.txt,depth=3 FooClass
HPjmeterEnhanced Profiling for HP-UX • Profiling option for HotSpot • -Xeprof:help • Collects CPU time separately per thread • Very low intrusion
HPjmeterHP JVM’s -Xeprof Option Options to use for HP’s JVM: -Xeprof:file=java.$$.eprof Specify the $$ in the script with the java command to include the Process Identifier in the name and ensure files are not overwritten
HPjmeterSPEC JVM 98 Benchmark Low Intrusion! Faster than Classic
HPjmeterElapsed (Wall Clock) and CPU Time • Inclusive and Exclusive times • Methods • Classes • Process • Thread • Call Graph • Tree form • Call hierarchy navigation • Ability to find callers quickly!
HPjmeterObject Creation • Allocated Objects • Residual Objects • Location in code where created • Reference Graph • Tree form • Ability to find referencing objects
HPjmeterHP JVM’s -Xeprof Option Options to use for HP’s JVM: -Xeprof:file=java.$$.eprof Specify the $$ in the script with the java command to include the Process Identifier in the name and ensure files are not overwritten
Program Information Elapsed Time Number of Methods Threads
Where’s the Time Going? • CPU bound application • Find method consuming highest amount of time • Find location in call chain
Exclusive Method Time (CPU)
Automatic Expansion Double-click for All Callers
Overloaded Methods Distinguish by Parameters
1. Select 2. Mark to Find
Exceptions • Bad programming practice to use as: • Terminators for searches • Indicators of a frequent exception condition • HPjmeter makes them easy to find • Guess:Exceptions Thrown
Switch to: Call Graph Call Count