Download
1 / 5
120 likes | 502 Views
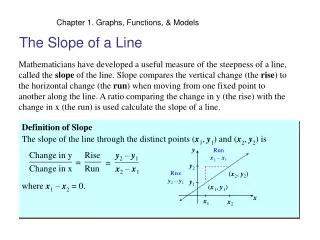
2. 3. y. 5. x. -5. -5. 5. Teaching Concept #1. Finding the Slope of a line from its graph. Find the Slope Using the Rise/Run Triangle Using two points. (0, -1). (-2, -4). y. 5. x. -5. -5. 5. Teaching Concept #2. Finding the Equation of a line from its graph.

E N D
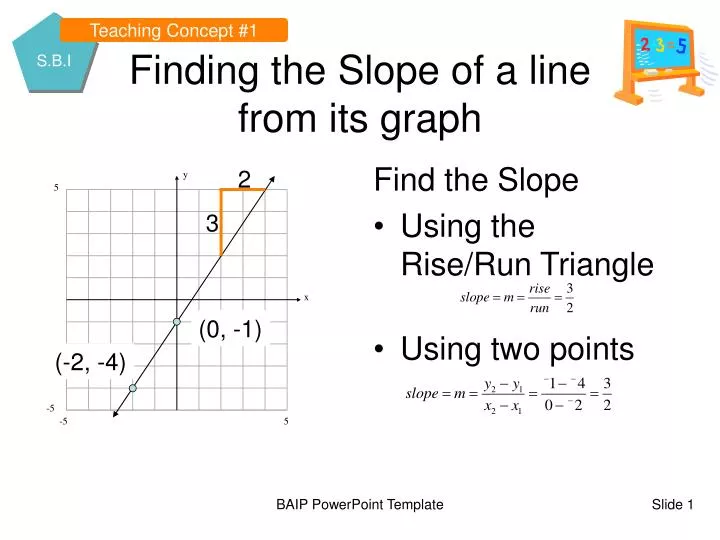
2 3 y 5 x -5 -5 5 Teaching Concept #1 Finding the Slope of a line from its graph Find the Slope • Using the Rise/Run Triangle • Using two points (0, -1) (-2, -4) BAIP PowerPoint Template
y 5 x -5 -5 5 Teaching Concept #2 Finding the Equation of a line from its graph • What is the slope (m) of the graph? • What is the y-intercept (b) of the graph? • What is the equation of this line? 3/2 -1 Y-intercept (b) BAIP PowerPoint Template
Price per Gallon $2.96 $2.95 $2.94 $2.93 $2.92 $2.91 $2.90 Day Application #1 Example • What is the slope (m) of the graph? • What is the y-intercept (b) of the graph? • What is the equation of this line? 1 .01/1=.01 .01 $2.89 Y-intercept (b) BAIP PowerPoint Template
y 5 x -5 -5 5 Concrete Example #1 • Approximate the line of best fit to describe the data. • What is the slope, y-intercept and equation of the line? y-intercept = 1, slope = -1/2 y = -1/2x + 1 • Predict the value of y when x = 7 Y = -1/2x + 1 Y = -1/2(7) + 1 Y = -2.5 BAIP PowerPoint Template
Approximate the line of best fit. Find its slope m = 1 Find its y-intercept b = 0 Find the equation of the line y = 1x + 0 Use the equation to predict the y value when x = -9 y = 1x + 0 y = 1(-9) + 0 y = -9 y 5 x -5 -5 5 Step-by-Step #1 Demonstration BAIP PowerPoint Template