Download
1 / 61
610 likes | 633 Views
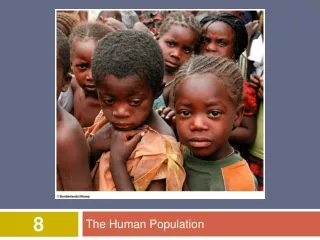
Explore the historical growth of the human population, from early hunter-gatherer societies to the impact of agriculture, urbanization, industrialization, and modern population dynamics. Learn about population control, reproductive strategies, carrying capacity, and environmental resistance factors. Gain insights into vital events, global population rates, and doubling time calculations. Understand the dynamics of birth rates, death rates, migration, and overall population growth trends. Discover the characteristics of population size, density, and age structure, as well as the impact on resource utilization and sustainability.

E N D
How Has the Human Population Grown Historically • Early Hunter Gatherers • Nomadic, With a Strong Sense of the Earth • Practiced Intentional Birth Control • Rise of Agriculture • Necessary for Survival • Animals became extinct via predation and altered habitat • Humans began to cultivate own food
C. Agriculture Gives Rise to Cities • Food Produced in Country, Consumed in City • Food wastes are no longer returned to soil • Soil becomes less productive • Waste of Populations Concentrated in Cities • Population Control in Medieval Societies • Infanticide • Plagues D. Industrialization • View of Children During Early Phases of Industrial Growth • Valued as cheap source of income and cheap labor • Exponential growth of populations • By 1900s, Birth Rate in Industrialized World Dropped • Rise in standards of living • Safe and inexpensive means of birth control introduced • Increase in the cost of child rearing
MI L L I O NS
Current World Population • Population ClockVital Events (per time unit) Global population was 6,379,870,732 On September 1, 2009 at 10:09 am • The global population grows by: • Nearly 2.3persons per seconds • Nearly 8,343 persons per hour • Over 200,234 persons per day • Over 73 million persons per year
How Much is a Billion? • 1,000 seconds = 16.7 minutes • 1 million-s = 16,677 min = 11.6 days • 1 billion-s = 11,574 days = 31.7 years • 1,000 pennies = ~ 88 ounces = 5.5 pounds • 1 million pennies = 5,500 pounds (~1-Suburban) • 1 billion pennies = 2,750 tons (~2 Space Shuttles)
Characteristics of a Population • Size: # if individuals in a pop. at any given time -changes in response to changes in the env, competition and predation • Density: # individuals/area • Age Structure: # of males and females at each age, from birth to death.
Human Population Dynamics • There are just three sources of change in population size — • fertility • mortality • "natural decrease" refers to population decline resulting from more deaths than births • migration • Net migration is the number of immigrants minus emigrants
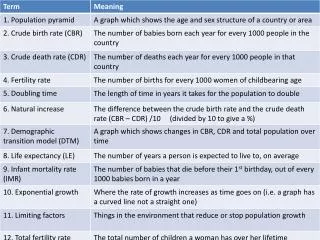
Rates of Global Pop. Changeuse: International Data Base http://www.census.gov/ipc/www/idbnew.html, then Online Demographic Aggregation • CBR (crude birth rate) = # births / 1000 population 1990: 24 now: 20.6 • CDR (crude death rate) = # deaths / 1000 population 1990: 9 now: 8.8 • Annual Growth Rate (AGR%) = (b + i) – (d + e) 1990: 1.5% now: 1.19% • growth rates have come down
Annual Growth Rate • If you are only given the birth rate and the death rate, the formula is: AGR %=(birth rate-death rate) x 100 1000 people OR…AGR%= (birth rate-death rate) 10
Doubling Time • Time it takes for a population to double itself, assuming that the current growth rate does not change. • DT=70/AGR% • You may be given the doubling time and asked to calculate the AGR% (EASY MATH!)
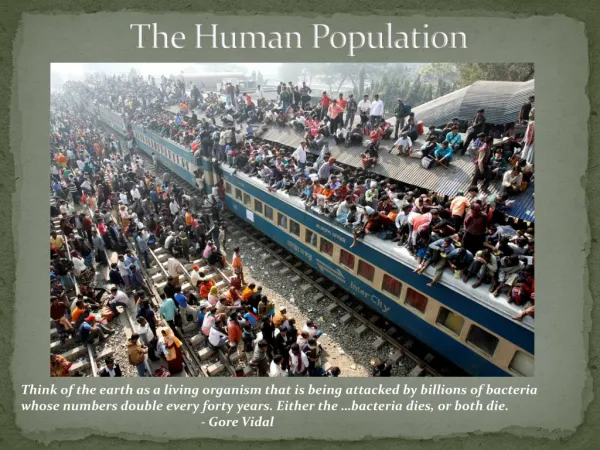
Overall, the world population is growing at a rate of about 1.7 per cent; if this rate continues, the population will double in 42 years. • Unabated, such a rate would lead to a point about 2000 years hence when the mass of humanity would weigh more, and be larger, than the Earth. • But, the growth rate is decreasing
Maximum Population Growth • W/o influence of biotic (living) and abiotic (non-living) …all populations will have a J curve (exponential) • Environmental Resistance: Organisms cannot reproduce indefinitely because of these factors (shortage of water, light, space, nutrients) • Carrying Capacity (K)=largest population that can be maintained for an indefinite period of time in a specific environment, assuming there are no changes.
Carrying Capacity, cont. • Limit to # of organisms is caused by abiotic (light, temp, nutrients, weather, etc)… and biotic (food, prey, disease resistant, adaptable, etc) limiting factors. • Population that is influenced by environmental resistance fluctuates and forms an S shape graph
Reproductive Strategies • r- selected species: • many small offspring • little prenatal care • adaptable to unstable climate • high population growth rate • Population size fluctuates wildly above and below carrying capacity (K) • Low ability to compete • small body size
Reproductive Strategies • K-selected species: • most live to reproductive age • fewer, larger offspring • low reproductive rate • larger adults/body sizes • lower population growth rate • population size stable and close to carrying capacity (K) • high ability to compete • invest in parental care of young
Survivorship • Type I: young don’t die easily; most death occurs at old age (K-strategists) • Type II: RARE-death happens equally at all ages • Type III: death common in early life and only the lucky survive (r-strategists) • These are generalizations and few populations fit one curve exactly.
Density Effects on Population • Some environmental events affect populations the same regardless of density=density independent (ex. Earthquakes, fires, bad weather) • Some environmental events affect populations MORE if population is dense= density dependent (population control-ex. Competition for resources, predation, disease, etc)
Types of Fertility Rates that Affect Human Population Growth • Total fertility rate (TFR) • The average number of children born to a woman • Average in developed countries = 1.5 • Average in developing countries = 3.8 • Worldwide 1990: 3.1 now: 2.76 • Replacement fertility rate (RFR) • The number of children a couple must have to replace themselves • A RFR of 2.1 for developed countries with low infant and child mortality rates • Africa RFR = 2.5
Factors that Affect Death Rates 1. Life Expectancy: avg. # of years to be lived by a person in the same country (good measure of quality of life) 2. infant mortality rate: IMR • infant deaths per 1000 live births (infant < 1 yr) • 1990: 62 now: 52.4 (normal in 1900: 200) ** # 1 cause of population increase is DEATH RATE, not increased births!
http://www.povertymap.net/pub/mipwa/sections/w-global/health-sanit/infant-mortality-2.htmhttp://www.povertymap.net/pub/mipwa/sections/w-global/health-sanit/infant-mortality-2.htm
Migration Net migration is the number of immigrants minus emigrants
Population Pyramids • Graphic device: bar graph • shows the age and gender composition of a region • horizontal axis: gender • male: left-hand female: right-hand • absolute number of people or % • vertical axis: age • 5-year or 10-year age groups
Population Pyramids • Population Pyramids on the Web • High Growth: Afghanistan • Moderate Growth: Mexico • Zero Growth: U.S. • Negative Growth: Austria or Italy
Demographic Transition • Movement of a nation from high population growth to low population as it develops economically • Transition as a result of four stages • Stage 1—Birth and death rates are both high • Stage 2—Death rates fall; birth rates remain high; growth rate rises • Stage 3—Birth rates fall as standard of living rises; growth rate falls • Stage 4—Growth rate continues to fall to zero or to a negative rate
Five Stages of the Demographic Transition • Used to be 4, now 5 stages • birth rates, death rates and growth rates systematically change through time as societies change: • modernize, urbanize • gain access to technology
Stage 1 • high birth rates, high (at time erratic) death rates, low growth rates • stage for much of human history, traditional societies • practically no country today
Stage 2 • high birth rates, declining death rates, rising growth rates • improvements in sanitation (water) and medicine • in Europe during Industrial Revolution • in developing countries since the 50s/60s • much of Africa today, some countries of Asia (Afghanistan, Nepal, etc.)
Stage 3 • continued decline of death rates, declining birth rates, growth rates decline from high to lower levels • change in behavior: adaptation to lower death rate, in particular infant mortality rate • economic change: urbanization (incentive to have fewer children) • Mexico today
Stage 4 & 5 • Stage 4: low birth rates, low death rates, low growth rates • United States today • Stage 5: low birth rates, rising death rates, declining growth rates (if birth rates drop below death rates: negative growth rates) • several countries of Europe today (Austria)
Demographic Trap • Population Path of Most Less-Developed Countries (LDCs) • “Trapped” in Stage 2 of Demographic Transition • Before 1970, LDCs seemed poised to make transition thanks to economic growth • Since 1970, economic growth has not kept pace with population • High birth and low death rates result in explosive population growth • Downward spiral in standard of living
Demographic Fatigue • Condition characterized by a lack of financial resources and an inability to deal effectively with threats such as natural catastrophes and disease • Possibility that countries suffering from demographic fatigues could slip back into Stage 1 of demographic transition
Age Structure & Population Projections • Baby boomers - half of U.S. population; use most of goods and services; make political and economic decision • baby-bust generation - born since 1965; may have to pay more income, health care and social security to support retired baby boomers; but face less job competition • Better health --> later retirement of baby boomers --> keep high-salary jobs=less higher paying jobs for others
Effects of Population Decline • As percentages of 60+ aged people increases, population begins decline • 60+population increase --> severe economic and social problems because 60+ consume • more medical care • Social Security • costly public services • Labor shortages require automation & immigration