Download

1 / 27
270 likes | 304 Views
Learn about population pyramids—a tool showing age and gender distribution in different countries through shape, proportion, and sex ratio. Explore how to interpret and analyze these pyramids for policy planning and demographic trends.

E N D
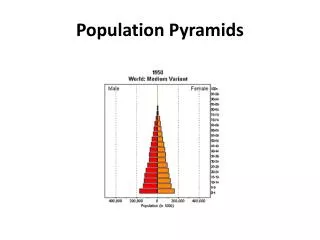
What is a population pyramid? • It is a diagram that gives information about the proportion of males and females in each age group. • Also shows: - proportion of young people (0 -14 ) - proportion of working people (15 – 59) - proportion of elderly people (60+) Each age-group designation is called a COHORT
What is a population pyramid? Vertical Axis - Age Groups Elderly dependents Working population Young dependents Horizontal Axis – Percentage / number
How to read a population pyramid? • Read the title e.g. country or city or racial group • Comment on general shape of the pyramid • Note the proportion of people in various age groups (cohorts) • Note the sex ratio • Interpret the data
Types of Population Pyramid 1. Triangular-shaped 2. Beehive-shaped Pyramid 3. Rectangular-shaped Pyramid Shape of pyramids is controlled by • Births (but mostly CBR!) • deaths, & • migrations.
Broad-based Pyramid Title: India, 2000 Shape: Broad Base - high birth rates Narrow Top - small elderly pop - high death rate Proportion: - Large proportion of young - high young dependency ratio Sex Ratio: Balance pyramid - Balance sex ratio
STOP • Where is India on the Demographic Transition Model?
Indonesia 2000 Malaysia 2000
Beehive-shaped Pyramid Title: Singapore, 2000 Shape: Rocket-shaped / Narrow Base – Low Birth Rates, Slow pop growth Proportion: Large proportion of working population, 15-59 yr old - large group of economically active pop Sex Ratio: Balanced pyramid
Hong Kong 2000 Taiwan 2000
STOP • Where are Beehive shaped pyramids on the Demographic Transition Model?
Rectangular Pyramid Title: Netherlands, 2000 Shape: Rectangular-shaped - Zero Pop Growth Narrow Base - Low Birth Rates - Life-expectancy is high e.g. 80+ - Low death rates Proportion: Bars of equal length - Balance Proportion Sex Ratio: Balance pyramid - Balance Sex Ratio
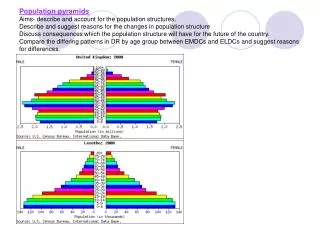
UK 2000 Netherlands 2000
STOP • Where are Rectangular Based Pyramids on the Demographic Transition Model?
Population Structure and Composition • Population pyramids…show age and gender groups. How do MDC’s and LDC’s differ? • 1.) Sex Ratio: # of males per 100 females. In general slightly more males born, but women outlive men • Eur and NA 95 males: 100 females • World wide 102 males: 100 females
Pop Structure and Composition – cont’d. • 2.) Age Distribution • Dependency Ratio: # of people too old or young to work, compared to # of people in productive yrs. • % of pop under 15 = % over 65 divided by % in between 15-65 multiplied by 100 • Tells you how many dependents for every 100 workers • Stage 2 countries: ratio is 1:1 (1 worker for every dependent) Dependents are young • Stage 4 countries ratio is 2:1 (2 workers for every dependent) Dependents are young and old
Age Distribution – cont’d • Graying of the pop in MDCs – more than ¼ of all govn’t expenditures in US, Canada, Japan, and W. Eur goes to Social Security, health care, and other programs for the elderly • Baby Boomer Cohort in US (born 1946-1964)…what does this mean for you? • Generation X = 1965-1980
Importance of Population Pyramids • Policy Planning ~ future housing estates ~ future schools ~ future jobs • Comparison with other countries ~ developed (US) vs developing (India)