Download
1 / 10
100 likes | 123 Views
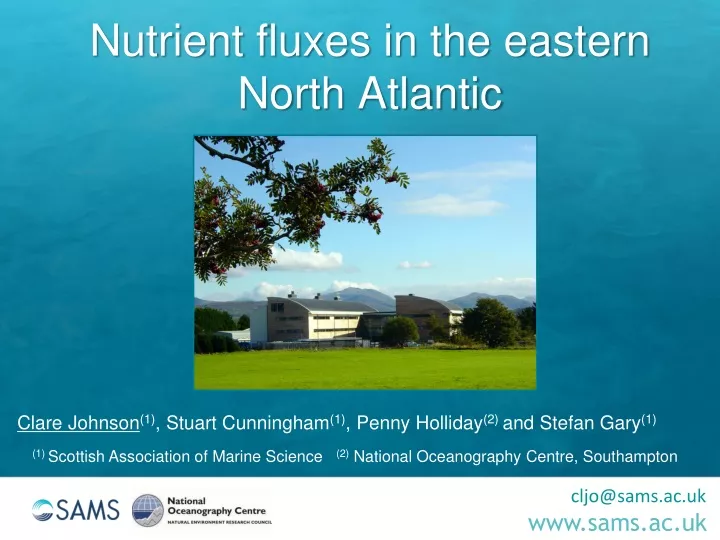
Explore nutrient distribution in the North Atlantic, tracking net nutrient sources to the Nordic Seas and Arctic Ocean. Analyze nutrient fluxes between 1997-2013 and propose future research directions for understanding variability.

E N D
Nutrient fluxes in the eastern North Atlantic Clare Johnson(1), Stuart Cunningham(1), Penny Holliday(2) and Stefan Gary(1) (1) Scottish Association of Marine Science (2) National Oceanography Centre, Southampton
Subpolar North Atlantic • Extended Ellett Line • 1997 onwards • Annual hydrographic section Iceland Nordic Seas Greenland 63 N 72 N 60 N Iceland Basin 64 N UK 57 N UK Rockall Trough 54 N North Atlantic 56 N 51 N 48 N 15 W 10 W 5 W 25 W 20 W 0° 40 N 15 W 0 30 W 45 W
Mean geostrophic transports (1997-2012) ≈ total transports (difference between geostrophic-derived surface velocities and altimeter-derived surface velocities minimised) Holliday et al., accepted, JGR, early view.
Nutrient data quality assessment Mean ± stdev 1997 -2011 (no QC) Sherwin et al., 2012, ICES Journal of Marine Science, 69,751-757. [SiO3] (µM) NO3 PO4 SiO3 Black: all data 1997-2013 Red: data from 1 cruise Decision: ‘good’ data mode ± 1 stdev Johnson et al., 2013, DSR, 82, 95-107 [NO3] (µM)
Example nutrient sections Iceland Rockall Scotland NO2+3 (µM) PO4 (µM) (µM) SiO3
Calculation of nutrient fluxes Two water masses defined by density: (1) Upper water < 27.50 kg m-3 (2) Overflow water > 27.85 kg m-3 Holliday et al., accepted, JGR, early view. Nutrient (µM)
Volume and nutrient transports 0.5 ± 0.5 3.9 ± 1.9 2.3 ± 1.3 Volume (Sv) UW +6.7 OW -2.1 Total +2.5 -2.1 ± 0.9 44.0 5.1 23.1 NO2+3 (kmol s-1) UW +72.2 OW -25.8 Total +46.4 -25.8
Volume and nutrient transports 2.8 0.3 1.3 PO4 (kmol s-1) UW +4.4 OW -1.9 Total +2.3 -1.9 17.0 1.9 7.4 SiO3 (kmol s-1) UW +26.3 OW -14.7 Total +11.6 -14.7
Summary • Nutrient distribution in eastern North Atlantic shows water mass structure as well as non-conservative behaviour. • Eastern North Atlantic net source of nutrients to Nordic Seas and Arctic Ocean. • First look mean values 1997 to 2013: NO2+3 +42.8 kmol s-1, PO4 +2.5 kmol s-1, SiO3 +11.6 kmol s-1 (likely to be slightly on high side). Future work • More sophisticated nutrient transport calculation. • Calculation of variability around mean transports. • Produce time-series of volume and nutrient transports between 1997 and present.
The research leading to these results has received funding from the European Union 7th Framework Programme (FP7 2007-2013), under grant agreement n.308299 NACLIM www.naclim.eu