Download
1 / 24
250 likes | 431 Views
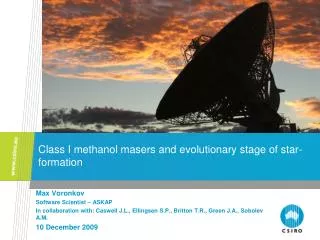
Class I methanol masers: interferometry and variability. Max Voronkov | ASKAP Software scientist. Astronomy and Space Science. CASS Maser workshop - 21 May 2013. Intro: two classes of methanol masers. Class I methanol (CH 3 OH) masers Scattered around YSOs (up to a parsec or so)

E N D
Class I methanol masers: interferometry and variability Max Voronkov| ASKAP Software scientist Astronomy and Space Science CASS Maser workshop - 21 May 2013
Intro: two classes of methanol masers • Class I methanol (CH3OH) masers • Scattered around YSOs (up to a parsec or so) • Many maser spots at arcsec resolution • Collisional excitation (e.g. by shocks) • Regions of star formation (high & low mass) • low-mass: Kalenskii et al., 2011, MNRAS, 405, 613 • Common masers: 36, 44, 84, 95 GHz, … • Rare/weak: 9.9, 23.4, series at 25, 104.3 GHz • Class II methanol (CH3OH) masers • Located in the nearest vicinity of YSOs • Usually just one maser spot at the arcsec scale • Radiational excitation (by infrared from YSO) • Regions of high mass star formation only • Common masers: 6.7, 12 GHz • Rare/weak: 19.9, 23, 28, 85/86, 37/38, 107, 108 GHz Subject ofthis talk
Common class I masers • J0-(J-1)1 A+: 44/95 GHz series • Major published interferometric surveys: Kurtz et al. (2004, ApJS, 155, 149); Cyganowski et al. (2009, ApJ, 702, 1615) • Lots of single dish work: e.g. Haschick et al. (1990, ApJ, 354, 556); Slysh et al. (1994, MNRAS, 268, 464); Val’tts et al. (2000, MNRAS, 317, 315); Ellingsen (2005, MNRAS, 359, 1498); Fontani et al. (2010, A&A, 2010, 517A, 56); Chen et al. (2011, ApJS, 196, 9) + heaps of unpublished data from Breen, Ellingsen and myself • J-1-(J-1)0 E: 36/84 GHz series • Single source interferometric papers, e.g. Fish et al. (2011, ApJ, 729, 14); Voronkov et al. (2010, MNRAS, 408, 133) • Single dish work, e.g. Haschick et al. (1989, ApJ, 339, 949); Kalenskii et al. (2001, ARep, 45, 26) We’vecompleted an ATCA survey at 36 and 44 GHz of all (deeply) southern class I masers known at the time of observations - this survey is the main topic of this presentation
G343.12-0.06 (IRAS16547-4247) See Voronkov et al. (2006, MNRAS, 373, 411) for more info on the source These are new results from the 36/44 GHz ATCA survey Some maser spots are associated with the outflow traced by H2 emission Rare masers are confined to a single spot near the brightest H2 knot + 44 GHz masers x 36 GHz masers
Association with expanding HII regions? Class I masers may be associated with ionisation shocks driven by an expanding HII region into surrounding molecular cloud, not just outflows. The analysis was originally based on rare 9.9-GHz masers (see Voronkov et al., 2010, MNRAS, 405, 2471), but 36/44 GHz masers can illustrate it better. G305.37+0.21 Red contours: 18-cm radio-continuum from MAGMO Blue contours:3-cm spatially filtered radio-continuum (Hindson et al., 2012, MNRAS, 421, 3418) Background: 3-colour GLIMPSE image Concentric circles: 50% sensitivity region at 36 and 44 GHz + 44 GHz masers x 36 GHz masers
Evolutionary stages traced by class I masers • Comparison of different class I transitions is still immature • But attempts are made, e.g. Pratap et al. (2008, AJ, 135, 1718) • Best to understand first how class I masers fit into common picture based on other maser species (i.e. OH, water, class II methanol) • Biased surveys • Association with multiple phenomena • Messy environment, e.g. triggered star-formation – not clear which generation of stars in the cluster the masers correspond to (as they may be quite offset) • There are indications that those class I masers which we know and studied in detail are in relatively evolved sources • However, we cannot completely exclude the presence of class I masers at the earliest stages
Expanding HII regions: G348.18+0.48 Triggered star-formation around RCW120, see Deharveng et al. 2009, A&A, 496, 177: Condensation 1 contains a massive deeply embedded core and a number of YSOs
Expanding HII regions: G348.18+0.48 Deharveng et al. 2009, A&A, 496, 177: Red rectangle roughly shows the area where the class I methanol maser emission is located No other masers in the immediate vicinity except an H2O maser (single-dish position is the pointing centre, Braz & Scalise, 1982, A&A, 107, 272)
ATCA 36 and 44 GHz survey • Masers reported by Slysh et al. (1994), Val’tts et al. (2000) and Ellingsen (2005) which are located south of -35o declination; 71 unique targets in total. • Largest interferometric survey to date, the first of this kind in the Southern hemisphere, the first interferometric survey at 36 GHz • Most sources show complex spatial and kinematic structure • First, we decomposed all emission into a collection of Gaussians in the spectral domain (each with a position measurement assuming point source) • Then, we grouped the Gaussians co-located in both position and velocity within 3σ (referred to as groups later on) • More than 80% of such groups are simple (i.e. just one Gaussian) • In total, there are 740 groups at 36 GHz and 816 groups at 44 GHz • Only 291 (or ≈23%) of them are common groups for both transitions
G333.47-0.16 at 44 and 36 GHz Red: 8.0 µm, green: 4.5 µm, blue: 3.6 µm Positions of masers overlaid on the 3-colour Spitzer IRAC image Extended infrared sources with emission excess at 4.5 µm (EGOs) may trace shocked gas Association with EGOs -a similar result to that of Cyganowski et al. (2009, ApJ, 702, 1615) + 44 GHz masers 6.7 GHz maser
G333.47-0.16 at 44 and 36 GHz Red: 8.0 µm, green: 4.5 µm, blue: 3.6 µm Positions of masers overlaid on the 3-colour Spitzer IRAC image Different transitions are highly complementary and are often crucial for the interpretation of morphology. + 44 GHz masers x 36 GHz masers 6.7 GHz maser
Velocity match and rest frequencies Adopted rest frequencies (from Müller et al. 2004) 44069.41 ± 0.01 MHz The uncertainty is equivalent to velocity uncertainty of 0.068 km s-1 (about the spectral resolution) 36169.265 ± 0.030 MHz The uncertainty is equivalent to velocity uncertainty of 0.24 km s-1 Velocity difference: 0.22 ± 0.03 km s-1 Suggest: 36169.238 ± 0.011 MHz
Relative flux densities at 36 and 44 GHz • For groups of components emitting at both 36 and 44 GHz: • It’s rare to have much stronger 36 GHz maser • Typically the 44 GHz flux densities are factor of a few higher • In most cases F(36)/F(44)<0.66 and F(44)/F(36)<15
Distribution of the separations from YSO The class II methanol maser at 6.7 GHz traces the YSO location The distribution is well fitted as an exponential decay with a scale of 253±14 mpc The same distribution within uncertainties for 36 and 44 GHz masers However, there might be an excess of detections near YSOs (projected distances about 0.5-1 pc)
Velocity distribution • Middle of the 6.7 GHz velocity range seems to be a good estimate of the systemic velocity • Hint at asymmetry for simple components emitting at both 36 and 44 GHz (although this is probably just due to low number statistics) • Hint on blue shift • High-velocity components are blue-shifted and seen predominantly at 36 GHz 36 GHz: mean -0.48 km s-1, σ=3.4 km s-1 44 GHz: mean -0.25 km s-1, σ=3.7 km s-1
G309.38-0.13: high-velocity feature at 36 GHz Background: Spitzer IRAC data Red: 8.0 µm, green: 4.5 µm, blue: 3.6 µm Excess of 4.5 µm may be a signature of Shocks (“ExtentedGreen Objects”) This is not the only such source. But we saw only blue-shifted high-velocity features and they are stronger at 36 GHz + 44 GHz masers x 36 GHz masers Garay et al. (2002): to increase CH3OH abundance shocks have to be mild (shock velocities not much more than 10 km/s interaction with moving gas) Voronkov et al. (2010, MNRAS,408, 133)
Variability? • Variability of class I masers is more or less an uncharted territory • Several class II masers show periodic and quasi-periodic flares • The nature of these flares still remains a mystery e.g. 6.7-GHz maser in G331.13-0.25 (Goedhart et al., 2004, MNRAS, 355, 553)
G331.13-0.24 • Location A has 9.9-GHz maser emission • The 6.7-GHz maser is (quasi)-periodic (period around 500 days)
G331.13-0.24 – monitoring program • This is the first long-term monitoring program of a class I methanol maser • Simultaneous observation at 6.7 GHz (class II) and 9.9 GHz (class I) • The 9.9-GHz masers are quite rare (only 5 known) • Eclipse-like dips in the 9.9-GHz light curve • The 9.9-GHz and 6.7-GHz masers are expected to react on pumping disturbances in the opposite ways • Their light curves will correlate if the flux of the HII region varies
G331.13-0.24 – ATCA/Hart comparison Comparison between two instruments (6.7-GHz, -84.3 km/s feature) • Hartebeesthoek data – monitoring data by JabulaniMaswanganye et al. • ATCA data – this project • Low level variations also seem real
Summary • Studies of different transitions are very complementary • Filling the dots in morphology, high-velocity features, modelling • Distribution of projected offsets of class I masers from YSOs traced by the 6.7 GHz methanol masers falls off exponentially with the scale of 253±14 mpc • Outflow shocks vs. shocks caused by other mechanisms • Some class I masers may be caused by expanding HII regions • Implications for maser-based evolutionary sequence • The 9.9 GHz class I maser in G331.13-0.24 dims occasionally • No hint on periodicity (yet?), no obvious connection with 6.7-GHz flares • The 6.7-GHz maser might have a slight flux reduction when the 9.9 GHz maser dims (reduction of the continuum flux?)
Thank you Astronomy and Space Science Max Voronkov ASKAP Software Scientist t +61 2 9372 4427 e maxim.voronkov@csiro.au w www.narrabri.atnf.csiro.au/people/vor010 Astronomy and Space Science