Download
1 / 14
140 likes | 232 Views
Regression analysis for clinical scores of Alzheimer’s Disease using multivariate machine learning method. Carlton Chu 1 ;Stefan Klöppel 1,2 ; Cynthia Stonnington 1,3 ;; Bogdan Draganski 1 ; Clifford Jack 3 ; John Ashburner 1 and Richard S.J. Frackowiak 1,4,5

E N D
Regression analysis for clinical scores of Alzheimer’s Disease using multivariate machine learning method Carlton Chu1;Stefan Klöppel1,2; Cynthia Stonnington1,3;; Bogdan Draganski1; Clifford Jack3; John Ashburner1 and Richard S.J. Frackowiak1,4,5 1 Wellcome Trust Centre for Neuroimaging, University College London, London, United Kingdom 2 Department of Neurology, Neurozentrum, University Clinic Freiburg, Freiburg, Germany 3 Division of Adult Psychiatry, Mayo Clinic, Scottsdale, AZ , USA (CS) and Department of Radiology, Mayo Clinic, Rochester, MN, USA (CJ) 4 Departement d’etudes cognitives, Ecole Normale Superieure, Paris, France 5 Laboratory of Neuroimaging, IRCCS Santa Lucia, Roma, Italy
Introduction • We present a “prediction based” analysis using one particular machine learning method called relevance vector regression (RVR) to train and predict three clinical ratings • Mini-Mental State Examination (MMSE); • Dementia Rating Scale (DRS) • Auditory Verbal Learning Test (AVLT)) • The input features used are the normalized and modulated gray matter probability maps, which characterize the gray matter density, as well as preserve the global volume
Validation x : image volumes y : one particular clinical ratings Training input Supervised Learning Algorithm (optimize the objective function) Training set {x,y} Training Predicted {y} Collected data {x,y} Trained Supervised Learning Algorithm {x} Testing set {x,y} Validation Accuracy True {y}
Pre-Processing • T1-Weighted Structural images were segmented using SPM5 into gray matter, white matter, and CSF probability maps. • The probability maps were iteratively warped to the population mean, which in turn was iteratively regenerated form the average of the warped images. This was done by DARTEL toolbox which may be released in a future SPM5 update.
Kernel Method • The modulated gray matter densities were used as the input features. • The kernel is a similarity measure between scans. For a linear kernel, it is the dot product between two scans. • To correct for inter-subject variations of total gray matter volume. We used the normalized kernel • In this implementation, the kernel can be • thought as basis functions
Kernel Regression • There are different variants, such as relevance vector regression (RVR), support vector regression (SVR), kernel ridge regression (KRR). • The General formula is • w is the weighting, y is the rating, x is one of the images, b is the bias (scalar), εthe noise, N the number of training set
Regression using Kernel Methods Here N is the number of training samples unused Training Testing
0 0 0 0 0 Relevance Vector Regression Basis functions y1 y2 w1 w2 = b 0 yn wn With unknown varaince With unknown varainces
Relevance Vector Regression The objective is to maximise the term p(y|α,σ2), which is called the marginal likelihood, or type-II maximum likelihood is basically the kernel matrix with a column of 1 appended at the end is the posterior weights
Our Study • A subset of subjects with all three ratings were selected from the classification study. (99 patients, 91 controls) • The subset contains 76 patients with diagnosis of probable AD and 91 cognitively normal controls of similar age and gender, (mean is 75.8, standard deviation is 8.4) • Scans were collected over about 10 years on 14 different scanners • Regression Prediction was applied to 3 clinical ratings independently • Mini-Mental State Examination (MMSE); • Dementia Rating Scale (DRS) • Auditory Verbal Learning Test (AVLT))
Results Correlation:0.70 Correlation:0.61 Whole Brain Gray Matter Correlation:0.71
Results Correlation:0.65 Correlation:0.66 Hippocampus ROI Correlation:0.67
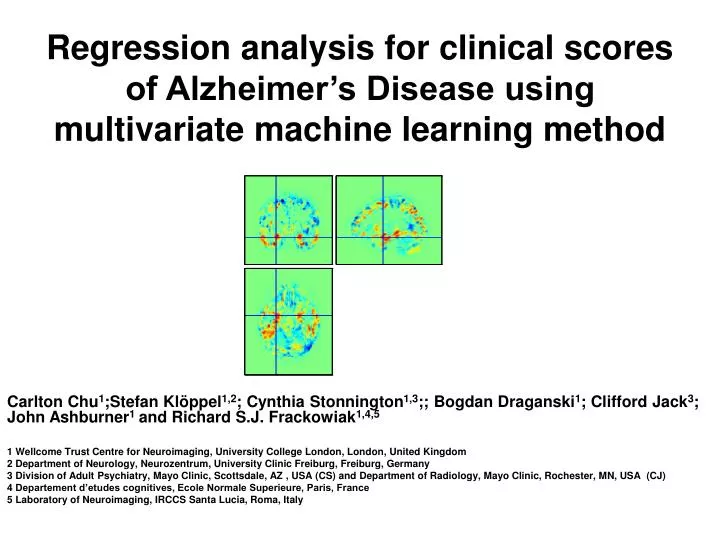
Weight Map (feature space) MMSE DRS AVLT
Conclusion • There is good linear predictability between clinical scores and gray matter densities when using multivariate machine learning methods. • This may assist clinical assessment when someone’s true rating differs too much with the predicted rating. • MMSE and DRS shows higher predictability than AVLT. • For classifying patients and controls with SVM, hippocampal ROI kernel resulted in higher leave-one-out accuracy (82%), than whole brain kernel (77%). • Correlation performance drops if hippocampal ROI kernel is used. This implies cortical regions contain further information to differentiate the degrees of cognitive impairment.