Download
1 / 75
750 likes | 1.02k Views
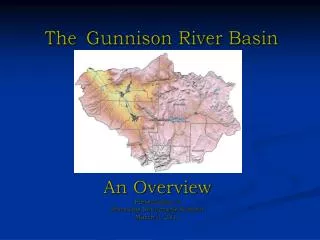
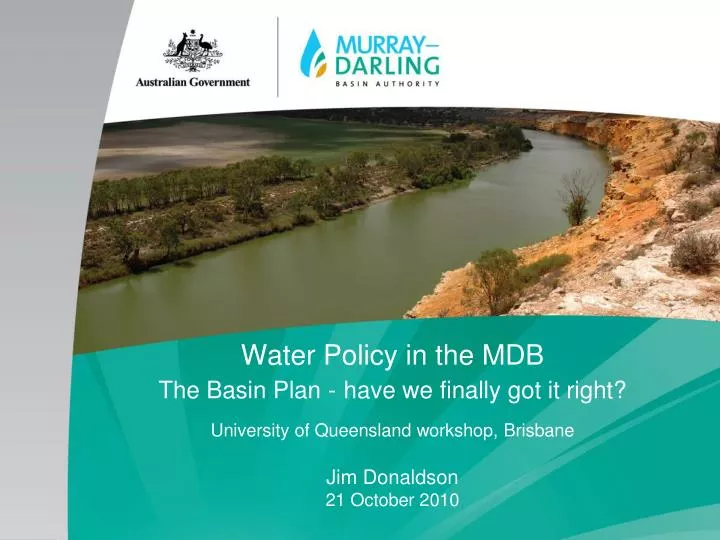
Water Policy in the MDB The Basin Plan - have we finally got it right? University of Queensland workshop, Brisbane Jim Donaldson 21 October 2010. The Basin. Murray-Darling Basin. Directly supports 3 million people Feeds approximately 20 million people Significant environmental values

E N D
Water Policy in the MDBThe Basin Plan -have we finally got it right?University of Queensland workshop, BrisbaneJim Donaldson21 October 2010
Murray-Darling Basin • Directly supports 3 million people • Feeds approximately 20 million people • Significant environmental values • 14% of Australia (size of Spain & France) • Australia’s three longest rivers • 40% Australia’s farmers • Agricultural exports earn $9b/year • Gross value of agricultural production $15b (40% Australia) – irrigation: $5.5b (15%) • Home to 34 major Indigenous groups
Value of MDB Irrigated Agricultural Production (07/08 GVIAP not yet available) ($ Million)
“dreams of taming the rivers, greening the desert, and making land productive, run deep in the national psyche”
Change? (CSIRO Water Availability – 2008)
The Need for Reform • Return extraction to a more sustainable level • Building a more certain future • Managing Basin Water resources for future generations • Support ecological health of the Basin • Sustained economic output
Building on past reform 1901 Constitution 1914 River Murray Commission 1987 Murray-Darling Basin Commission 1990’s Cap on Diversions & Water markets 2004 National Water Initiative & The Living Murray First Step 2007 Commonwealth Water Act & Murray-Darling Basin Authority 2008 COAG Agreement 2010 Guide to the proposed Basin Plan 17
Brief history of water policy • 1890’s – 1980’s development era: “drought, royal commission, new dam” • 1994 COAG reforms: environmental flows, unbundling water and land “titles” • 1995 MDB “Cap” on more extractions • National Water Initiative 2004: reaffirms commitments to reform agenda, e-flows and role of markets in reallocating water • 2007: Water Act
What does the Water Act say? • Water Act sets out quite specific basis for developing the Basin Plan – environment! • There is a hierarchy of objectives and considerations guiding Basin planning • Socio-economic related objectives are to be pursued to the extent they do not compromise other objects of the Act • such as ensuring return to environmentally sustainable levels of extraction
Objectives of the proposed Basin Plan • Ecological health • optimise social, cultural and economic wellbeing • Sustainable limits on take • Environmental resilience • Appropriate water quality • Efficient and effective water markets • Transition path to implementation 20
Key Elements of the Basin PlanPage 8 of the Concept Statement
Conceptual Cycle • Identify Key Environmental Assets and Key Ecosystem Functions • Determine environmental water requirements of the Key Environmental Assets and Key Ecosystem Functions • Calculate possible SDL • Assess socio-economic impact • Consider alternative scenarios • Implement thru Environmental Watering Plan • Simplicity belies complexity
SDL proposals - process How much additional water does the environment need? What are the potential impacts on the community? What are the sustainable diversion limit proposals? How to manage the transition? 25
Env Water Requirements Determined using 2 integrated components • Assessment of indicator assets • Detailed assessment of 18 floodplain and wetland sites • Environmental water requirements are typically high flows/floods • High flows contribute most volume, so biggest impact on SDLs • Assessment of key ecosystem functions • Broader assessment of flows at 88 sites across the Basin • Main contribution are low flow environmental water requirements (high flows already assessed by assets) • Also provides a mechanism to check the impact of the indicator asset approach on high flows across the whole Basin (other key environmental assets)
Indicator Assets Lower Balonne River Floodplain System Gwydir Wetlands Narran Lakes Booligal Wetlands Lachlan Swamps Great Cumbung Swamp Lower Murrumbidgee Wetlands Macquarie Marshes Lower Darling River System Hattah Lakes Riverland – Chowilla Floodplain Mid Murrumbidgee Wetlands Coorong, Lower Lakes and Murray Mouth Wimmera River Terminal Wetlands Barmah Millewa Forest Edward Wakool River System Lower Goulburn River Floodplain Gunbower Koondrook Perricoota Forests
30,000 wetlands 2,442 key environmental assets 4 key ecosystem functions 106 hydrological indicator sites 18 KEAs 88 KEFs 28 28 Range of additional surface water for the environment: 3,000 - 7,600 GL/y
Env Water Requirements Examples of Environmental Water Requirements
Key Ecosystem Functions Assessment of flows required by 4 physical processes • Creation and maintenance of habitats - for use by plants and animals • Transportation and dilution of nutrients, organic matter and sediment • Providing connections along the river - for migration and recolonisation by plants and animals (incl. fish) • Providing connections across floodplains, adjacent wetlands and billabongs - for foraging, migration and recolonisation by plants and animals
Key Ecosystem Functions • The 4 processes require a variety of flow types • Each flow type is important • Each flow type is assessed
Modelling and SDLs • SDLs informed by modelling of environmental water requirements (assets and functions), and other analysis • SDL in each region is affected by environmental water requirements in that region, and also downstream requirements • Models are very important tools, but they can’t answer all policy challenges and therefore can’t determine SDLs on their own
MDB Surface and groundwater models Warrego IQQM Nebine IQQM Paroo IQQM Lower Balonne IQQM St George SGCS13NT Barwon-Darling IQQM Middle Condamine IQQM Condamine MODFLOW Menindee IQQM Upper Condamine IQQM Bidgee IQQM Border Rivers MODFLOW Lower Bidgee MODFLOW Border R. and Mac B. IQQM Moonie IQQM Murray BigMod Lower Gwydir MODFLOW Murray MSM Gwydir IQQM Upper Namoi MODFLOW Eastern Mt Lofty Ranges 6*WATERCRESS Peel IQQM Namoi IQQM Lower Namoi MODFLOW Macq-Castlereagh 6*IQQM Southern Riverine Plains MODFLOW Macquarie MODFLOW Lachlan IQQM Wimmera REALM Mid-Lachlan MODFLOW Lower Lachlan MODFLOW Avoca REALM Daily Snowy SIM_V9 Weekly ACTEW REALM GSM REALM Monthly Upper Bidgee IQQM Ovens REALM Mid Bidgee MODFLOW
Current diversion limits • Includes all take (total 13,700 GL/y) • For surface water this includes: • Watercourse diversions (10,940 GL/y) • Diversions from streams • Floodplain harvesting • Interception activities (2,740 GL/y) • Farm dams • Forestry plantations 35
SDL proposals • Draws on social and economic assessments and environmental water requirements • Indicates a range of reductions: • 3,000 GL/y, 3,500 GL/y and 4,000 GL/y • Surface water reductions > 4,000 GL/y • Unacceptable social and economic outcomes • Surface water reductions < 3,000 GL/y • Outcomes do not meet the environmental requirements • Groundwater: • Aggregate 186 GL/y reduction across 11 aquifers 36
SDL proposals - considerations Satisfy environmental water needs in each tributary catchment Connected catchments can contribute to Murray or Darling environmental water needs Some disconnected catchments – e.g. Paroo, Lachlan Darling River system – limited ability to contribute to Murray needs More highly developed catchments can make bigger contribution to environment water needs 37
SDL proposals - considerations Equal % reductions in current diversion limits (watercourse diversions and interception) Where reductions large to satisfy internal catchment needs, no further reductions Constrain maximum reduction in watercourse diversion component 38
Water resource plan areas 19 surface water resource plan areas (29 SDLs) 39
SDL proposals * If only this component is reduced Surface water: 40
When it takes effect proposed Basin Plan Final Basin Plan 41 2010 2014 2020
Assessing impact on communities • Impact of different reductions • Impact of reductions on different farming sectors • Off-farm (flow-on) impacts • Impact of reduction at Basin and regional scales 42
What we were asked to do Assess the likely economic and social implications of setting SDLs and developing the Basin Plan Inform setting of SDLs Report on implications to government
Socio-economics beyond SDL’s • Socio-economic info can also be used to: • Advise on mitigation arrangements • Temporary Diversion Provisions, risk allocation, trade rules, Buyback • Inform state water resource plan requirements and development
Socio-economic impact assessments Studies undertaken: • Baseline socio-economic circumstances • Review of previous studies in the Basin • Review of structural adjustment pressures • Economic modelling and analysis • Local profiles and assessments • Indicators of community vulnerability & adaptive capacity • Effects of change in water availability on Indigenous people • Assessment of benefits • Responses of financial institutions to changes 45
Consumptive water use 8,000 7,000 6,000 5,000 4,000 GL 3,000 2,000 1,000 0 Agriculture Mining Manufacturing Other Households Water supply industries industry
ABARE Economic Modelling • Modelling of economic implications of potential reductions in water availability • Focus of project: • Basin-wide, inter-regional, economic modelling • Consider scenarios of reductions • Agricultural sector and regional flow-on effects • Report on changes in value of irrigated agriculture, land use and water use • Magnitude and indicative distribution of impacts • Report on impactsat national, basin, regional levels
ABARE’s Approach Irrigated agriculture model of MDB Shocked with changes in SDLs Regional level estimates Industry crop estimates AusRegion CGE model Regional economy impacts (GRP, employment) Some downscaling possible but limitations Impacts of reduced farm expenditure on towns Results compared with other models UQ, Monash CoPS, PC, Wentworth
Local profiles & analyses (Marsden Jacob Associates) Socio-economic assessments of likely local implications of reductions in SDLs Focus of project: Community profiles for regional communities Identify industry impacts and flow-on effects Assess vulnerability and adaptive capacity at local scale in 12 targeted irrigation districts Interviews with regional stakeholders and business and community phone surveys Consider a range of water use reduction scenarios
Project overview • To assist the MDBA with • enhanced understanding of social and economic circumstances of communities • likely impacts of reduced water availability • Vulnerability • Adaptability • Consortium led by Marsden Jacob Associates • RMCG, Geoff McLeod, Tim Cummins, and expert advisors EBC, Anthony Hogan, DBM