Download
1 / 24
250 likes | 405 Views
Financial Analysis. Methods to monitor the fiscal status of the organization over a period of timeMonthly, quarterly, annuallyMethodsBreak even analysisIncome statementsCash flow statementBalance sheetBudget statement. Break Even Analysis. How many units of a product must be sold in order t

E N D
1. Financial analysis & statements
2. Financial Analysis Methods to monitor the fiscal status of the organization over a period of time
Monthly, quarterly, annually
Methods
Break even analysis
Income statements
Cash flow statement
Balance sheet
Budget statement
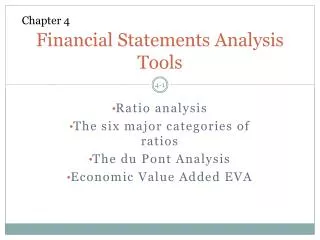
3. Break Even Analysis How many units of a product must be sold in order to cover all costs of production of that unit
Method #1
BE=F+(V*Units sold)/Units sold
4. Break Even - Example
5. Break Even - Example
6. Break Even - Example
7. Break Even Analysis How many units of a product must be sold in order to cover all costs of production of that unit
Method #2
Formula
BE=F / (P � V)
BE= Break even point
F = Fixed costs
P = Selling price per unit
V = Variable costs per unit
8. Break Even BE=F / (P � V)
P=$60
BE=2650 / (60-7)
BE=2650 / 53
BE=50 people
9. Break Even Analysis Bike rental business
Fixed costs = $8000
Variable costs = $10/person
Bike rental = $50/bike
10. Break Even Analysis Bike rental business
Fixed costs = $8000
Variable costs = $10/person
Bike rental = $50/bike
BE=F / (P � V)
BE=8000/(50-10)
BE=8000/40
BE=200 bikes
11. Break Even Analysis
12. Break Even Analysis Profit
$40 profit per bike over 200
250 bikes = 50*$40=$2000
350 bikes � 150*$40=$6000
Loss � 150 bikes
Expenditures
8000+($10*150)=$9500
Revenues
$50*150 bikes=$7500
13. Income Statement Measures profitability over a period of time
i.e. annually, quarterly, or monthly
Income = revenues � expenses
Shows how profitable your company is�how much money will be made after all expenses are taken out
With a new company�
Typically 1st year you prepare monthly projections
Years 2-3 Quarterly projections (4 times a year)
Years 4-5: Annually (once a year)
Example�.
14. Income Statement
15. Cash Flow Statement Income statement provided information about revenues coming in and expenses going out, but not cash in and cash out
What�s in the bank
Eliminates some of the creative accounting of the income statement (ex. depreciation)
Negative cash flows okay, but not sustainable forever
16. Cash Flow Statement Negative monthly cash flow � means that you dipped into the savings in this seasonal business.Negative monthly cash flow � means that you dipped into the savings in this seasonal business.
17. Cash Flow Statement Negative monthly cash flow � means that you dipped into the savings in this seasonal business.Negative monthly cash flow � means that you dipped into the savings in this seasonal business.
18. Balance Sheet Financial condition of a business at a single point in time
End of month, quarter, year
Provides information about a company�s assets, liabilities, and owner�s equity (capital)�owes vs. owns
Assets = liabilities + equity or
Equity = assets � liabilities
Terms�
19. Balance Sheet Current assets
Cash & assets that can be turned to cash quickly (within a year)
Inventory
Bank deposits
Accounts receivable
Amts not yet collected from customers but are due
Fixed assets
Used to produce good & aren�t for sale
Land, building, machinery, equipment
Depreciation
Declining value of a fixed asset
20. Balance Sheet Accounts payable
What is owed to suppliers for things bought on credit
Salaries
Current liabilities
Debts for regular business operations that will come due within a year)
Long term liabilities
Due after a year
Mortgages, bonds, large loans
Net worth (owner�s equity)
Portion of business owned free and clear of all debts
21. Assets � what you have of value; liabilities � what you owe; Equity is the net worth or what you own free and clear. Assets � what you have of value; liabilities � what you owe; Equity is the net worth or what you own free and clear.
22. Budget Statement Expended monies
Allocated monies
Revenues received
% of allocated that is commited
23. Budget Statement