Download
1 / 28
300 likes | 830 Views
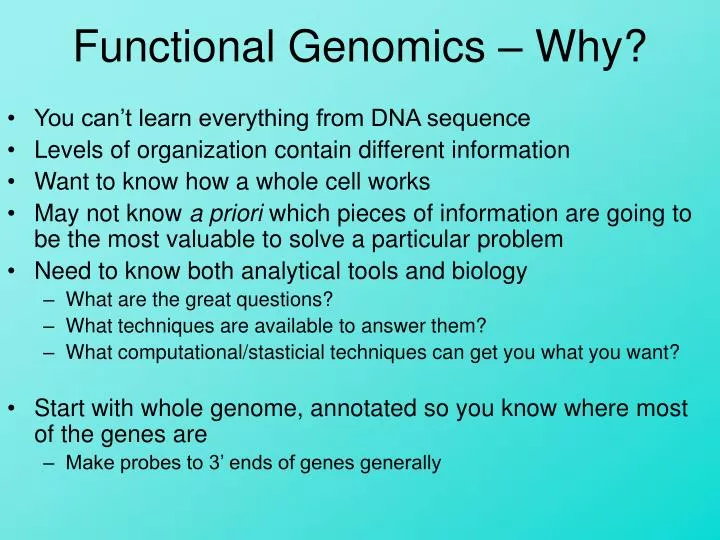
Functional Genomics – Why?. You can’t learn everything from DNA sequence Levels of organization contain different information Want to know how a whole cell works May not know a priori which pieces of information are going to be the most valuable to solve a particular problem

E N D
Functional Genomics – Why? • You can’t learn everything from DNA sequence • Levels of organization contain different information • Want to know how a whole cell works • May not know a priori which pieces of information are going to be the most valuable to solve a particular problem • Need to know both analytical tools and biology • What are the great questions? • What techniques are available to answer them? • What computational/stasticial techniques can get you what you want? • Start with whole genome, annotated so you know where most of the genes are • Make probes to 3’ ends of genes generally
Microarrays Extract RNA and incorporate label Combine Scanned image Hybridize
Types of Microarrays • For measuring mRNA • Affymetrix, Nimblegen, Illumina (short oligos made on the slide) • Oligonucleotides (short DNA – typically 70-mers) • For identifying where proteins bind DNA and non-coding or other RNAs • Tiling arrays • For identifying SNPs • http://www.illumina.com/ • There are even protein arrays!
Why microarrays? • You can get a great deal of data – multiplexed, uses very little reagent, can use standard detection devices • Similar techniques are used for working with RNA and DNA and similar attachment chemistries • Can carry out enzyme reactions on the arrays for sequencing and other analyses
Microarray experiments have multiple stepseach step introduces some variability Slide Manufacture Cell harvest RNA preparation Slide Post-processing Labeling reaction Pre-hybridization Hybridization Washing Scanning Data Analysis
Microarrays Extract RNA and incorporate label Combine Scanned image Hybridize
What questions are you asking? • First of all – you are measuring mRNA abundance – so questions are about gene expression at the mRNA level • What are the levels of all mRNAs • How do they change • Are there interesting changes or groups that provide insight into some process or state?
Design and analysis • Experimental design is critical • Analysis tools: • Hierarchical clustering • Gene lists based on expression • Time course analysis • Statistics • Gene Ontology • Pathway analysis • Classifiers – to identify biomarkers
Types of clustering • Hierarchical clustering • K-means (centroids), Self-organizing maps (partitioning vectors) • Principal Components Analysis • Force-directed placement, etc.
Clustering • Look at correlations • Clustering – multidimensional data -tutorial http://www.elet.polimi.it/upload/matteucc/Clustering/tutorial_html/
Hierarchical clustering Self-organizing maps
So you want to do an array: • Experimental design • What are your samples, how many, time intervals, how collected, RNA preps • Randomization – not something biologists think about • What is your reference? • Reproducibility • Pearson’s R, other dissimilarity measures • Biological and technical reproducibility • Normalization – always a question • Global normalization is appropriate in some situations • External controls are good – how many and where
Types of microarray experiments • Single time points: • What mRNAs accumulate or disappear? • Look at promoters (not rigorous), examine mutants in genes whose mRNAs accumulate • Examine whether unknown genes are in some known pathway (not rigorous) • Developmental or time-course experiments • How many cascades of events occur • Examine mutants to determine causality or relatedness • Group genes to examine promoters • Begin to evaluate pathways • Can use mutant or wild type cells or tissues
0 1 2 3 4 5 6 7 8 3 Time (hours) 1 2 4 log2 (- 2.25) (3.00) 3 2 1 1 0 log2 (R/G) 2 -1 4 -2 0 1 2 3 4 5 6 7 8 Can cells in SP cultures respond to oxidative stress? Analysis of oxidative stress at 30 min intervals. Time (hours) Major Changes in mRNA Abundance Occur Upon Exposure to Oxidative Stress (50 µM menadione) http://biology.unm.edu/biology/maggieww/Public_Html/aragonmrna.pdf
The Automated Sampler Solenoid Valve 2μm Inline Filter (optional) Microcontroller Collection Tube 2L Flask Air Supply AC Power Supply Not to Scale
100 110 120 130 140 150 160 170 180 300 Time (sec) 10 20 30 40 50 60 70 80 90 0 (2.83) (Fold) (6.73) What Are the Kinetics of the Rapid Response? Oxidative Stress at 10s intervals
Microarray Analysis of a Pol II Mutant Is de novo Transcription Required? Increase in Transcript Abundance is Not the Result of de novo Transcription Wild type Parental Mutant (- 2.00) log2 (2.00)
Stationary Exponential Phase - - + + - - - - - - - - - - Menadione Protease T K P T K P - - - - - - - + + + + + + + 1 2 3 4 5 6 7 8 9 10 11 12 13 14 Lane (- 7.00) log2 (7.00) Are these mRNAs protease labile? The transcripts are soluble after protease treatment of T0 cells Many of the transcripts are released by oxidative stress Sequestration does not occur in cells in exponentially dividing cultures
Microarrays need to be under control • Error can be introduced at many steps • Controls are critical • Statistical problems because the data is very high dimensional with very little replication • Normalization within and between arrays needs to be well understood • Many assumptions are made that go untested • But – getting better!