Download
1 / 21
270 likes | 658 Views
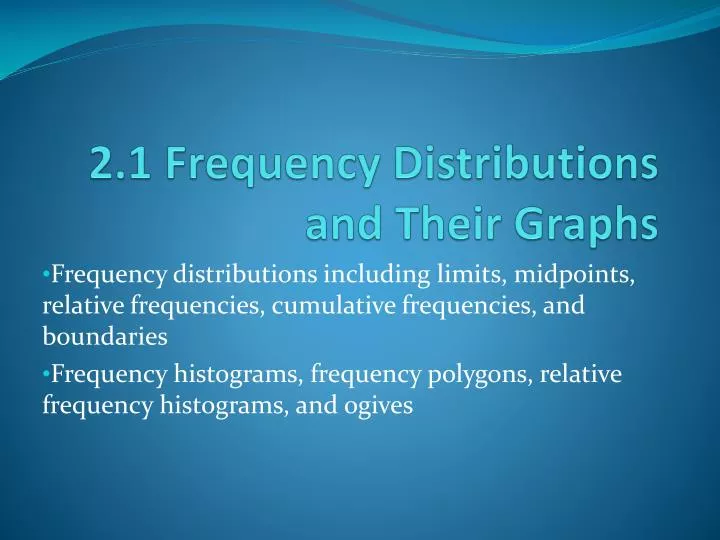
2.1 Frequency Distributions and Their Graphs. Frequency distributions including limits, midpoints, relative frequencies, cumulative frequencies, and boundaries Frequency histograms, frequency polygons, relative frequency histograms, and ogives. Frequency distribution.

E N D
2.1 Frequency Distributions and Their Graphs Frequency distributions including limits, midpoints, relative frequencies, cumulative frequencies, and boundaries Frequency histograms, frequency polygons, relative frequency histograms, and ogives
Frequency distribution A frequency distribution is a table that shows classes or intervals of data entries with a count of the number of entries in each class.
Frequency The frequency fof a class is the number of data entries in the class.
Try it yourself 1 • Constructing a Frequency Distribution from a Data Set Construct a frequency distribution using the ages of the 5o richest people data set listed in the Chapter Opener on page 37 (or below). Use eight classes. 89, 89, 87, 86, 86, 85, 83, 83, 82, 81, 80, 78, 78, 77, 76, 73, 73, 73, 72, 69, 69, 68, 67, 66, 66, 65, 65, 64, 63, 61, 61, 60, 59, 58, 57, 56, 54, 54, 53, 53, 51, 51, 49, 47, 46, 44, 43, 42, 36, 35
Midpoint The midpoint of a class is the sum of the lower and upper limits of the class divided by two. The midpoint is sometimes called the class mark.
Relative Frequency The relative frequency of a class is the portion or percentage of the data that falls in that class. To find the relative frequency of a class, divide the frequency f by the sample size n.
Cumulative Frequency The cumulative frequencyof a class is the sum of the frequencies of that class and all previous classes. The cumulative frequency of the last class is equal to the sample size n.
Try it yourself 2 • Finding Midpoints, Relative Frequencies, and Cumulative Frequencies Using the frequency distribution constructed in Try it yourself 1, find the midpoint, relative frequency, and cumulative frequency of each class. Identify any patterns.
Finding Midpoints, Relative Frequencies, and Cumulative Frequencies
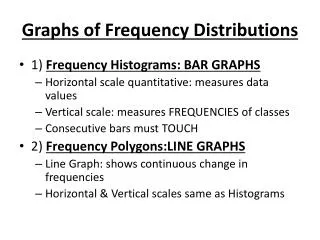
Frequency Histogram A frequency histogram is a bar graph that represents the frequency distribution of a data set. A histogram has the following properties. The horizontal scale is quantitative and measures the data values. The vertical scale measures the frequencies of the classes. Consecutive bars must touch.
Try it yourself 3 • Constructing a Frequency Histogram Use the frequency distribution from Try it yourself 2 to construct a frequency histogram that represents the ages of the 50 richest people. Describe any patterns.
Try it yourself 3 • Constructing a Frequency Histogram
Try it yourself 4 • Constructing a Frequency Polygon Use the frequency distribution from Try it yourself 2 to construct a frequency polygon that represents the ages of the 50 richest people. Describe any patterns.
Try it yourself 4 • Constructing a Frequency Polygon
Try it yourself 5 • Constructing a Relative Frequency Histogram Use the frequency distribution in Try it yourself 2 to construct a relative frequency histogram that represents the ages of the 50 richest people.
Try it yourself 5 • Constructing a Relative Frequency Histogram
Cumulative frequency graph A cumulative frequency graph, or ogive, is a line graph that displays the cumulative frequency of each class at its upper class boundary. The upper boundaries are marked on the horizontal axis, and the cumulative frequencies are marked on the vertical axis.
Try it yourself 6 • Constructing an Ogive Use the frequency distribution from Try it yourself 2 to construct an ogive that represents the ages of the 50 richest people. Estimate the number of people who are 80 years old or younger.
Try it yourself 7 • Using Technology to Construct Histograms Use a calculator or a computer and the frequency distribution from Try it yourself 2 to construct a frequency histogram that represents the ages of the 50 richest people. STAT, ENTER Enter midpoints in L1, enter frequencies in L2 2ND, STATPLOT Turn on Plot 1, highlight Histogram Xlist: L1, Freq: L2 ZOOM 9