Download
1 / 28
280 likes | 515 Views
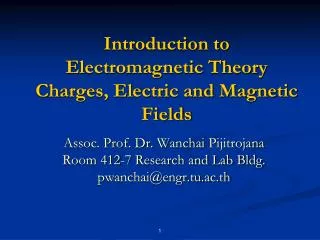
Visualizing Electromagnetic Fields: The Visualization Toolkit. Michael Selvanayagam. Visualization. What is the purpose of visualizing electromagnetic (EM) Fields?. Visualization. Understand the geometry of the problem Show the properties of the EM field Communicate functionality.

E N D
Visualizing Electromagnetic Fields:The Visualization Toolkit Michael Selvanayagam
Visualization What is the purpose of visualizing electromagnetic (EM) Fields?
Visualization • Understand the geometry of the problem • Show the properties of the EM field • Communicate functionality
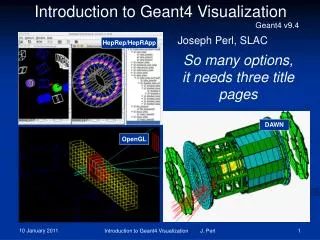
Examples • Good Visualization: Transformation Optics Using Graphene, AshkanVakil and Nader Engheta Science 10 June 2011: 332 (6035), 1291-1294. Kosmas L. Tsakmakidis, Allan D. Boardman & OrtwinHess Nature450, 397-401 (15 November 2007)
Motivation • Generate ‘professional’ looking figures • Convey both geometry and electromagnetic properties • This allows the audience to understand how things work in an easier fashion
Motivation • Useful for Research: • Help yourself to understand the problem • Help the audience to understand the problem • Useful for Teaching: • Demonstrate basic physics in a visually appealing manner
Possible Approaches • Existing CAD tools: • HFSS, SEMCAD, CST, COMSOL…. • Software packages
Visualization Toolkit (VTK) • A Graphics API for drawing 3D graphics • Open source • Use the API in C++, Java, Tcl, Python • Python in this talk. Also allows use of numpy/scipy
Visualization Toolkit (VTK) • Object Oriented Framework • Sits on top of OpenGL • There are GUI environments: • ParaView, Mayavi
VTK History and Uses • Written by former GE engineers • Popular in CFD and medical imaging http://cmg.soton.ac.uk/people/kvm/ http://www.kitware.com/viscontest/img/brainconnectivity.png
VTK Basics • The elements of a VTK program Pipeline Metaphor From: http://www.cs.uic.edu/…~jbell/CS526/Tutorial/VTK_Pipeline.jpg
VTK Basics • To Build A ‘Scene’ You Need: • A Rendering Window (vtkRenderWindow) • A Light Source (vtkLight) • A Camera (vtkCamera) • Mappers (vtkMapper) • Map data and geometry to computer graphics • Actors (vtkActor) • Define their properties (vtkProperty)
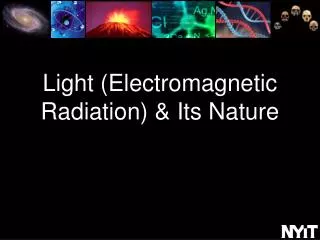
Examples (Photonics) • The Hybrid Waveguide: • An optical waveguide with good mode confinement • A hybrid between a dielectric and plasmonic waveguide • See [1]. [1] M. Alam, J. Meier, J. Aitchison, and M. Mojahedi, "Propagation characteristics of hybrid modes supported by metal-low-high index waveguides and bends," Opt. Express 18, 12971-12979 (2010).
Examples (Photonics) • The Hybrid Waveguide: • Show the geometry of the waveguide • Show how the EM mode is confined in the waveguide
Examples (Photonics) • Schematic Ag SiO2 SiO2 Si
Examples (Photonics) • Hybrid Mode Plot
Examples (Photonics) • Code • Read in Data • Define Scene • Set up camera • Set up Renderer and Window cam1=vtk.vtkCamera() cam1.SetFocalPoint(x0,y0,z0) cam1.SetPosition(x1,y1,z1) cam1.Zoom(1.5) ren1=vtk.vtkRenderer() ren1.SetActiveCamera(cam1) ren1.ResetCamera() renWin=vtk.vtkRenderWindow()
Examples (Photonics) • Code Continued • Draw Geometry Substrate=vtk.vtkCubeSource() Substrate.SetXLength(x) Substrate.SetYLength(y) Substrate.SetZLength(z) Substrate.SetCenter(cen) mapSub=vtk.vtkPolyDataMapper() mapSub.SetInput(Substrate.GetOutput()) aSub=vtk.vtkActor() aSub.SetMapper(mapSub) ren1.AddActor(aSub)
Examples (Photonics) • Code Continued • Draw Surface Plot • Setup Grid • Add Points and Data • Set up filter and lut • Map surface plot • Add to scene as an actor grid=vtk.vtkStructuredGrid() grid.SetPoints(points) grid.GetPointData().SetScalars(Efield) filter = vtk.vtkStructuredGridGeometryFilter() filter.SetInput(grid) lut=vtk.vtkLookupTable() lut.Build() map=vtk.vtkPolyDataMapper() map.SetInput(filter.GetOutput()) map.SetLookupTable(lut) vecActor=vtk.vtkActor() vecActor.SetMapper(map) ren1.AddActor(vecActor)
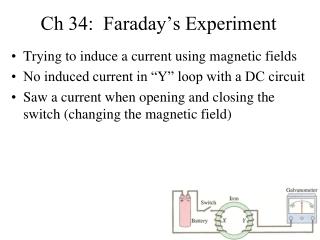
Examples (EM) • Ray Tracer • We need to understand how EM waves propagate inside very large domains like tunnels • Use a ray tracer to study the problem. (Written By NeerajSood)
Examples (EM) • Ray Tracer • Show the geometry of the problem being studied • Visualize the rays in that geometry
Examples (EM) • Schematic Transmitter Hallway Reciever
Examples (EM) 1 Bounce 2 Bounces
Examples (EM) 3 Bounces 3 Bounces
Examples (EM) • Code: • Define Scene • Read in Geometry • Draw Geometry • Read in Rays • Draw Rays • Draw Arrows
VTK Pros and Cons • Pros: • A very powerful tool. Can `visualize’ almost anything: • scalars, vectors, tensors, complex numbers.. • A lot of examples online • Reusable code
VTK Pros and Cons • Cons: • Setup is difficult • Very steep learning curve • Need to learn intricacies of API • Need to understand the framework • Lots of implicit assumptions
Final Thoughts • VTK is a tool for 3D visualization • If you want to play around with 3D visualization it is worth investigating • Code is available if you’re curious