Download
1 / 35
360 likes | 541 Views
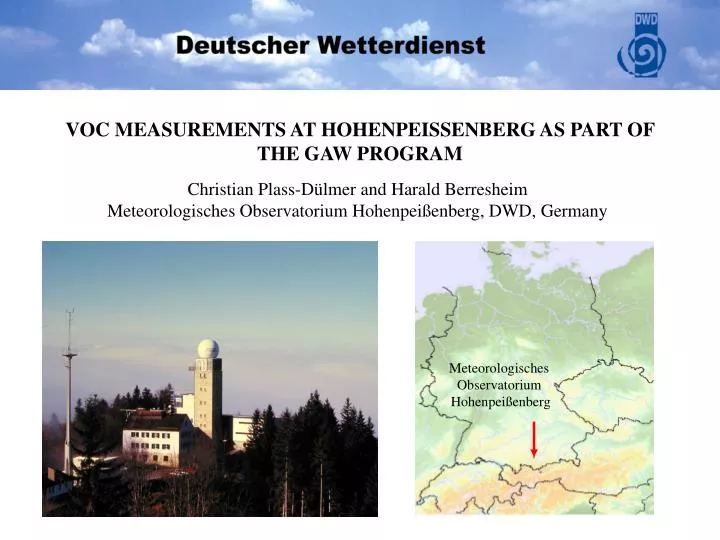
Meteorologisches Observatorium Hohenpeißenberg. VOC MEASUREMENTS AT HOHENPEISSENBERG AS PART OF THE GAW PROGRAM. Christian Plass-Dülmer and Harald Berresheim Meteorologisches Observatorium Hohenpeißenberg, DWD, Germany. VOC Monitoring - Objectives. GAW expert meeting Report 111, 1995

E N D
Meteorologisches Observatorium Hohenpeißenberg VOC MEASUREMENTS AT HOHENPEISSENBERG AS PART OF THE GAW PROGRAM Christian Plass-Dülmer and Harald Berresheim Meteorologisches Observatorium Hohenpeißenberg, DWD, Germany
VOC Monitoring - Objectives • GAW • expert meeting Report 111, 1995 • Global distribution, seasonality and trends • understanding the biogeochemical cycling (sources, sinks, chemistry) • impact on ozone, photooxidants, oxidising capacity, aerosol, climate, health • WMO (1995): WMO-BMBF Workshop on VOC - Establishment of a „World Calibration/Instrument Intercomparison Facility for VOC“ to Serve the WMO Global Atmosphere Watch (GAW) Programme, WMO Report, 111. • EMEP • Strategic Plan 2004 • European distribution and trends • Compliance monitoring (compliance with protocols) • understand physical and chemical processes • Support for EMEP model • EMEP (2003): The EMEP Monitoring Strategy 2004-2009 - Background document with justification and specification of the EMEP monitoring programme 2004-2009, eds. Kjetil Torseth and Oystein Hov, EMEP, CCC-Report 9/2003.
GAW-Program VOC: MOHp • Stage 1: C2-C9 hydrocarbons HC • Stage 2: C10-C14 HC (biogenic) • Stage 3: oxygenated VOC (OVOC) • GC-FID • GC-MS/FID • GC-PDHID/FID Measurements at1:00 and 13:00 CETca. 80 VOC Detection limits: 1 ppt ... 10 ppt Accuracy: C2-C9 HC 5-25%, Terpenes 20-40% QA and QC Procedures VOC Intercomparisons: NOMHICE, AMOHA, and GAW
Biogenic VOC at Hohenpeißenberg monthly means of noon-time concentrations (preliminary data)
Annual cycles of noon- and midnight monthly mean concentrations Summer ratio day/night: Dt [OH] = 1-4 1010 s molec/cm³ c(day) = c(night) exp(-k[OH]Dt)
Turn over-rates due to reactions with OH radicals Jun-Aug Dec-Feb, 10 106 molecules/(cm³s) 3.5 106 molecules/(cm³s) (2004 data at noon time and measured OH)
Research Topics at Hohenpeißenberg with respect to VOC • trends and distribution HC, OVOC‘s • oxidizing capacity VOC turn-over, radical precursors • aerosol formation and growth semi-volatile prod. • oxidant formation VOCturn-over • source attribution tracer, signature Isoprene, monoterpenes, light alkenes, formaldehyde semi-volatile products of monoterpenes and aromatics various C2-C10 hydrocarbons, OVOC‘s and halogenated VOC
Future Requirements (presented at GAW workshop Tutzing 2004) • Stations: report VOC+errors to WDCGG/EMEP • SAG: establish DQO‘s, QA/QC procedures, Pilot stations, SOP‘s, error assessment • WCC: continue audits+intercomp., provide standards, SOP‘s, error assessment, data evaluation • QA/SAC: support SAG, WCC, and stations; motivate and coordinate • scientific user: analyse spatial distributions and temporal evolution, sources and sinks • all: workshops/conferences to communicate
GC-2 Varian 3400CX MS/FID C5-C14 Hydrocarbons Halocarbons Oxygenated VOC
GC-1 Varian 3600CX, FID C2-C8 Hydrocarbons
VOC patterns of boundary-layer and free troposphere air Ethan Propan i-Butan n-Butan i-Pentan n-Pentan 2-M-Pentan n-Hexan n-Heptan Ethen Propen 1,3-Butadien Isopren Acetylen Propin Benzol Toluol Ethylbenzol Boundary-layer p,m-Xylol Free troposphere o-Xylol 1 10 100 1000 Mixing ratios, pptv Photochemical age: about 8 days
X 10 Ratios Winter/Summer Measurement Lifetime 1 Ethan Toluol Benzol Propan i-Butan Propen Ethen Propin n-Butan i-Pentan Acetylen n-Pentan 1-Buten p,m-Xylol t-2-Buten 1,3-Butadien Annual Cycle: Winter-Summer Ratios of selected VOC Box: Atmosphere OH O3 T=1/(K[OH]+k[O3]) VOC-emissions = const. T-Winter MR-Winter OH O3 Nov-Feb 0.2E6 cm-³ 32 ppb Jun-Aug 1.7E6 cm-³ 51 ppb Despite of chemical impacts, sources and meteorology are important = T-Summer MR-Summer
10000 X 1000 100 mean mixing ratio 1998, pptv Alkanes Alkenes 10 Alkynes Aromatics 1 1E-13 1E-12 1E-11 1E-10 k(OH), cm³/(s molecule) Mixing Ratios 1998vs. reactivity with OH
Biogenic Emissions - mixing ratios versus temperature 1000 Sum of Terpenes Isoprene 800 ---> Emission driven by temperature (meteorology) ---> Ozone-smog 600 ---> Particle-formation ---> climate ! Mixing Ratio, pptv 400 200 0 -10 -5 0 5 10 15 20 25 30 Temperature, °C
5% x 0% linear Trend, %/year Alkanes -5% Alkenes Alkynes Aromatics -10% 1E-13 1E-12 1E-11 1E-10 k(OH), cm³/(s molecule) Do we see changes in the composition of anthropogenic VOC? Trends are still uncertain due to the short observation periode!
C2-C7 n-alkanes C4-C7 i-alkanes C2-C6 alkenes C7-C8 aromatics
VOC Monitoring Program NMHC Measurements by GC/FID - canister / on-line • GAW • stage 1: C2-C9 hydrocarbons • stage 2: C10-C14 hydrocarbons • stage 3: oxygenated VOC • establish 3 pilot stations • EMEP • level 2: C2-C7 hydrocarbons • level 2: C1-C6 carbonyls • level 3: C6-C12 hydrocarbons • level 2 = approx 15 sites • level 3 = research stations GAW/EMEP: 30 target compounds C2-C9
VOC QA / QC • GAW • Report 111, ... • Intercomp.+audits by WCC • training (GAWTEC) • EMEP • Manual (EMEP/CCC-1/95) • intercomp.+audits by NILU • data screening by NILU and local laboratories VOC Data Quality Objectives accuracy NMHC: 10 - 20 % accuracy NMHC 15-25% no calibration gas standards no QA / QC protocolSOP‘s ?
Yearly „Trend“ of anthropogenic VOC: Measurements and Estimates DWD estimated estimated Hohenpeißen- UBA/EMEP emissions emissions berg Waldhof (UBA ) (UBA ) 1998-2003 1992-2002 1990-2001 2000-2001 Measurements -4% -5% Transport Emissions -12% 0% total (without solvents) -10% 0% (National Emission-Inventory Germany - 2002, UBA, 31/07/03)
Plass-Dülmer und Berresheim, Meteorologisches Observatorium Hohenpeißenberg
Annual winter (Nov-Feb) median concentrations of hydrocarbons at Waldhof (DE), Kosetice (CZ) and Donon (FR), red letters are results by NILU analysis, blue by national lab. Reference: VOC Measurements 2002 Sverre Solberg, NILU, Kjeller, Norway EMEP / CCC-Report 8/2004 Reference O-92016
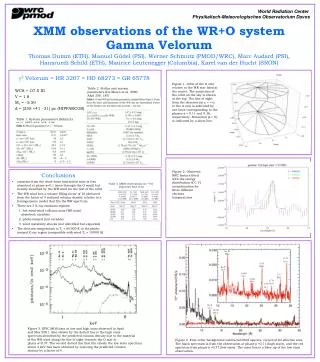
QC - Recent International Intercomparison Experiments NOMHICE: analytical preformance of participating labs AMOHA: analytical preformance + canisters + sampling procedure GAW-WCC: analytical preformance + on-line / canister NOMHICE - NonMethane Hydrocarbon InterComparison ExperimentTasks 1 - 5 (Apel et al., JGR, 1994, 1999, 2003) AMOHA - Accurate Measurements of Hydrocarbons in the AtmosphereTasks 1 - 3 (Slemr et al., 2002)Task 4 (Plass-Dülmer et al., in preparation) First GAW - WCC - VOC - Intercomparison 2003 B. Rappenglück et al.
First GAW - VOC Intercomparison 2003 Task-1: Synthetic Mixture (73 components, 0.2-10 ppb) Task-2: ambient air - parallel sampling participant / WCC • Task-1 • 62 % within Data Quality Objectives (30 Target Compounds) See poster by Rappenglück et al.
VOC Monitoring in Europe - EMEP network (since 1992) GAW Global Stations Zeppelin Pallas, since 1992 Birkenes Hohenpeissenberg, since 1998 Mace Head, since 2001 ? Izana, no VOC
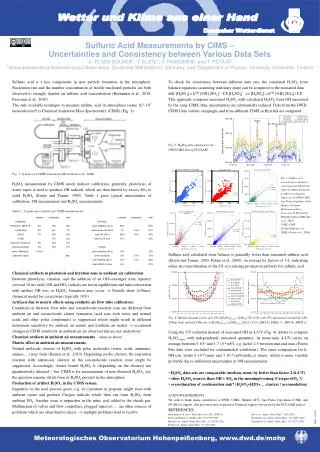
VOC Distribution (median) in Winter-Months 2002 (EMEP VOC Report, 2004) Lifetime: ca. 60 days
EMEP Trend Results no clear trends in Northern Europe (Finnish sites) decreasing concentrations in Central Europe(20-50% / 1992-2000) and a levelling off after 2000 Caution: Trends are uncertain
Summary • GAW and EMEP: similar objectives, VOC compounds, and QA /QC • VOC intercomparisons: - Data Quality Objectives are met by 2/3 of results - data quality varies substantially from lab to lab - problem: error assessment (DQO) • European VOC monitoring is mainly provided by EMEP • Results of European monitoring: - higher concentrations in Central and Eastern Europe - trends of anthr. VOC in Central Europe by 0-10% / year