Download
1 / 33
330 likes | 455 Views
A Numerical Simulation of the Hurricane Charley Storm Surge in the Light of Lessons Learned from Tampa Bay. R.H. Weisberg and L. Zheng FWRI Marine Quest 04/09/05. Submergence based on a 5-foot uniform sea level rise. Submergence based on a 10-foot uniform sea level rise.

E N D
A Numerical Simulation of the Hurricane Charley Storm Surge in the Light of Lessons Learned from Tampa Bay R.H. Weisberg and L. Zheng FWRIMarine Quest 04/09/05
Hurricane Storm Surge Simulation Requirements • 1) A high resolution numerical circulation model with • capabilities for flooding and drying land. • Accurate wind and pressure fields. • 3) High resolution bathymetry and elevation data.
Hydrodynamic Model: FVCOM Advantages: • Using unstructured triangle grid to better represent complex coastal and estuarine geometry. • Using simple finite-difference which has simple discrete structures and computational efficiency. 3) Incorporating flooding/drying skill which is critical for storm surges study.
Lessons learned from Tampa Bay Based on prototypical category 2 and 4 storms that approach the region from several different directions, at differentapproach speeds, and making landfall at different locations. http://ocg6.marine.usf.edu
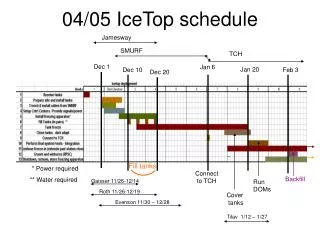
Model Grid for Tampa Bay Storm Surge Experiment Minimum resolution: 100 m
Category 2 storm translating at 5 m/s Courtney Compbell Causeway W. Howard Frankland Bridge Gandy Bridge Sunshine Skyway Bridge
Tampa St. Pete 24 Hour OCG @ USF
Tampa St. Pete 28 Hour OCG @ USF
Tampa St. Pete 30 Hour OCG @ USF
Case I: IRB landfall from the west. Case II: Translation up the Bay. Case III: Coast parallel from the south Case IV: Coast parallel from the north Arrow: landfall time
Category 2 storm translating at 5 m/s Courtney Compbell Causeway W. Howard Frankland Bridge Gandy Bridge Sunshine Skyway Bridge
Case I: IRB landfall from the west. Case II: Egmont Key. Case III: Sarasota Case IV: Tarpon Springs Arrow: landfall time
Category 2 storm making landfall at Indian Rocks Beach from the west with speeds of • 5 m/s (10 knot) • 10 m/s (20 knot) 3. 2.5 m/s (5 knot)
IRB landfall from the west with translation speeds of: 5 m/s, 10 m/s, and 2.5 m/s. Arrow: landfall time
Storm making landfall at Indian Rocks Beach from the west with speeds of 5 m/s • Category 2 • Category 4
Tampa 30 Hour OCG @ USF
IRB landfall from the west at 5 m/s for: category 2 category 4. Arrow: landfall time
The Surge in Tampa Bay Is Sensitive to: 1) the storm intensity; 2) the landfall location; 3) the speed of approach; and 4) the direction of approach.
Punta Gorda W. side of CH E. side of CH N. Pine Is. Ft. Myers Captiva Sanibel Is. Big Carlos Pass
Summary 1) Based on the lessons learned from Tampa Bay experiments we explain the relatively small H. Charley surge by virtue of: • The approach direction from SW to NE and subsequent translation up the estuary. • The rapid approach speed (16 knots). • The small storm radius (10~20 km). 2) We account for the breach at North Captiva Island by the large across-barrier-island sea level gradient that occurred as the H. Charley passed by.
Acknowledgments This work was supported by the Office of Naval Research, grants # N00014-98-1-0158 and N00014-02-1-0972 and by the U.S. Geological Survey, order # 4-SPSA-11920. Changsheng Chen (UMassD) kindly shared the FVCOM code, and Timothy Liebermann (SFWMD)kindly shared the CH merged bathymetric and topographic data set.