Download
1 / 3

E N D
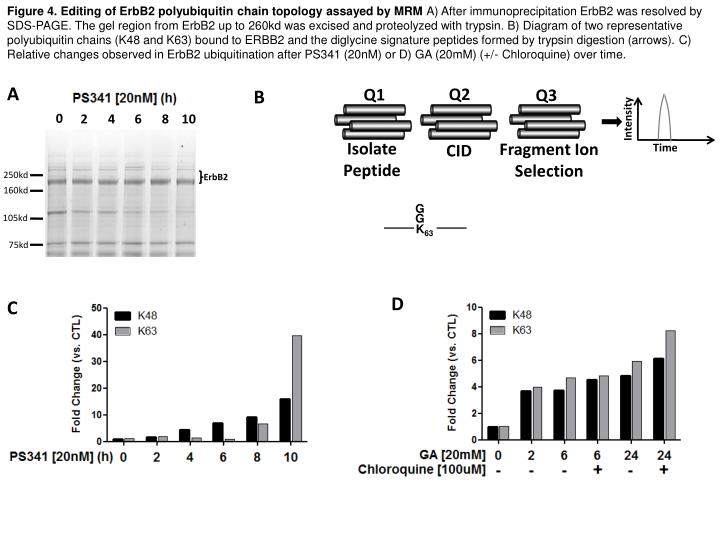
Figure 4. Editing of ErbB2 polyubiquitin chain topology assayed by MRM A) After immunoprecipitation ErbB2 was resolved by SDS-PAGE. The gel region from ErbB2 up to 260kd was excised and proteolyzed with trypsin. B) Diagram of two representative polyubiquitin chains (K48 and K63) bound to ERBB2 and the diglycine signature peptides formed by trypsin digestion (arrows). C) Relative changes observed in ErbB2 ubiquitination after PS341 (20nM) or D) GA (20mM) (+/- Chloroquine) over time. A Q2 Q1 Q3 B 0 2 4 6 8 10 Intensity Isolate Peptide Fragment Ion Selection CID Time 250kd ErbB2 160kd G G 105kd K63 75kd D C
Supplementary Figure 1. MRM assay to asses the relative changes in ERBB2 polyubiqtuin chain topology. The peptide sequences and m/z values for MRM assays. All 7 possible ubiquitin linkages were measured as well as three tryptic peptides from ErbB2 (residue numbers in brackets) that were used to normalize the relative ubiquitin levels between samples. MRM Ions Q1 Q3 Peptide Sequence Peptide Name
Figure 4. Editing of ErbB2 polyubiquitin chain topology assayed by MRM A) After immunoprecipitation ErbB2 was resolved by SDS-PAGE. The gel region from ErbB2 up to 260kd was excised and proteolyzed with trypsin. B) Diagram of two representative polyubiquitin chains (K48 and K63) bound to ERBB2 and the diglycine signature peptides formed by trypsin digestion (arrows). C) Relative changes observed in ErbB2 ubiquitination after PS341 (20nM) or D) GA (20mM) (+/- Chloroquine) over time A B 0 2 4 6 8 10 250kd ErbB2 160kd 105kd 75kd C D