Download
1 / 39
400 likes | 683 Views
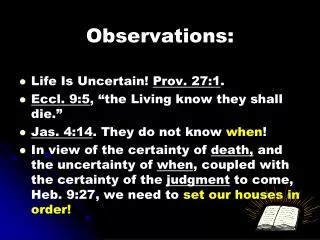
Observations. ENVI 1400 : Lecture 10. Synoptic Observations. Observations synchronised worldwide at: 0000, 0600, 1200, 1800 UTC. Some stations report more frequently: every 3 hours or hourly, some at only some of the above times. Two main sets of measurements: Surface Observations

E N D
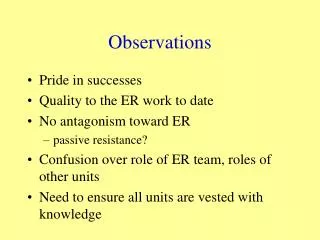
Observations ENVI 1400 : Lecture 10
Synoptic Observations Observations synchronised worldwide at: 0000, 0600, 1200, 1800 UTC. • Some stations report more frequently: every 3 hours or hourly, some at only some of the above times. Two main sets of measurements: • Surface Observations • Upper air observations (radiosondes) ENVI 1400 : Meteorology and Forecasting
Surface Observations Basic measurements: • Temperature, dew-point temperature, pressure, rainfall, wind speed & direction. • Manual observations of cloud cover & current weather: precipitation type, visibility,… Also: • Automated measurements of solar & IR radiation, visibility ENVI 1400 : Meteorology and Forecasting
Sources of Data • Surface-based measurements • Surface observations • Radiosondes • Remote Sensing • Satellites • Radar profilers, lidar, sodar • Numerical Model Analyses • Closely linked with forecasts ENVI 1400 : Meteorology and Forecasting
Pyranometer – solar radiation Pyrgeometer – infra red radiation ENVI 1400 : Meteorology and Forecasting
Beaufort Scale Defined by Admiral Sir Francis Beaufort (1774-1857) ENVI 1400 : Meteorology and Forecasting
Surface observations ENVI 1400 : Meteorology and Forecasting
Charts of surface observations use a set of standard symbols to represent the meteorological conditions: Wind speed and direction Temperature Humidity (dew point) Cloud cover Precipitation type & (approximate) amount Pressure Symbols are defined by the World Meteorological Organisation (WMO), but feature some national additions or modifications. For UK surface maps see: www.medvale.demon.co.uk/weather/charts.htm http://meteocentre.com/analyse/map.php?hour=0&lang=en&map=UK Surface Observation Charts ENVI 1400 : Meteorology and Forecasting
http://meteocentre.com/analyse/map.php?hour=0&lang=en&map=UK ENVI 1400 : Meteorology and Forecasting
http://www.medvale.demon.co.uk/weather/charts.htm ENVI 1400 : Meteorology and Forecasting
http://www.meteo.uni-koeln.de/meteo.php?show=En_We_Wk ENVI 1400 : Meteorology and Forecasting
Temperature Pressure Visibility 20 = 2000m 19 013 20 Cloud cover CurrentWeatherconditions 14 Dew point Wind barb ENVI 1400 : Meteorology and Forecasting
Clear skies 4/8 (50%) cloud cover 1/8 or less 6/8 (75%) cloud cover 7/8 or more cloud cover 2/8 (25%) cloud cover 100% cloud cover 3/8 cloud cover ENVI 1400 : Meteorology and Forecasting
Visibility obscured M Missing data ENVI 1400 : Meteorology and Forecasting
Long bar = 10 5 kts 15 kts Short bar = 5 25 kts Flag = 50 60 kts Units are KNOTS or m s-1 (usually knots) ENVI 1400 : Meteorology and Forecasting
N Wind Wind direction N.B. Wind barb points in the direction the wind is blowing, but direction is quoted as angle wind is coming from (eg 135°, or southeasterly). ENVI 1400 : Meteorology and Forecasting
013 Interpreting Pressure Reports If reported value > 500: Initial 9 is missing. Place it on left and divide by 10. e.g. 827 becomes 982.7 mb If reported value < 500 Initial 10 is missing. Place it on left and divide by 10. e.g. 027 becomes 1002.7 mb ENVI 1400 : Meteorology and Forecasting
RAIN DRIZZLE SNOW light light light moderate moderate moderate heavy heavy heavy FREEZING RAIN light rain shower light snow shower light moderate moderate rain shower moderate snow shower ENVI 1400 : Meteorology and Forecasting
Haze thunderstorm Tropical Storm Fog Heavythunderstorm Hurricane Ice crystals Hail ENVI 1400 : Meteorology and Forecasting
Radiosondes • Balloon-borne, ascent from surface to ~25km • Measure Temperature, humidity, pressure • Windspeed & direction are derived from change in GPS measured position • In past, position determined from radar reflection, or manual tracking with theodolite ENVI 1400 : Meteorology and Forecasting
Upper air observations ENVI 1400 : Meteorology and Forecasting
An increasing variety of automated measurements are available: Instruments fitted to commercial airliners Weather radar Radar wind profilers Sodar wind profilers RASS temperature profilers Satellite remote sensing: Surface temperatures Cloud height Water vapour concentration Aerosol loading Temperature profiles Chemical concentrations (ozone, CO,…) Surface winds over oceans Other Measurements ENVI 1400 : Meteorology and Forecasting
Radar wind profiler: Obtains wind profiles from doppler shift of radar signal from array of antenna. Beam steered by phasing transmission. ENVI 1400 : Meteorology and Forecasting
Wind profiler time-series ENVI 1400 : Meteorology and Forecasting