Download
1 / 41
410 likes | 538 Views
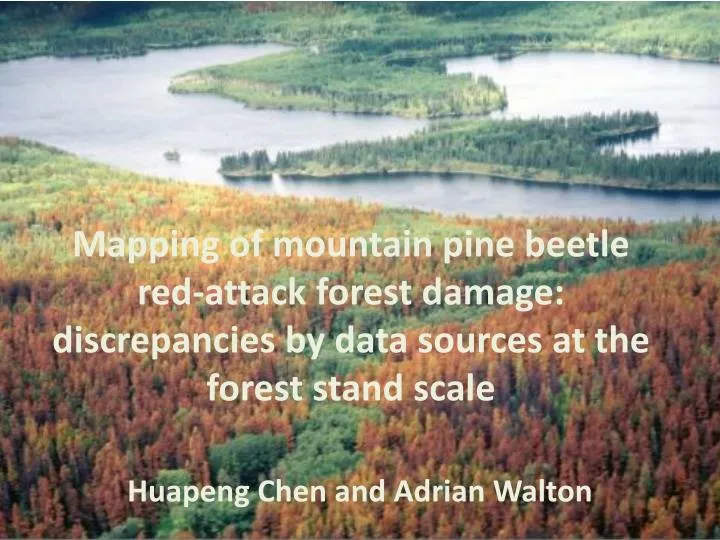
Mapping of mountain pine beetle red-attack forest damage: discrepancies by data sources at the forest stand scale. Huapeng Chen and Adrian Walton. Outline. Background Introduction Objectives Study area Data and method Results Discussion Conclusions. Background.

E N D
Mapping of mountain pine beetle red-attack forest damage:discrepancies by data sources at the forest stand scale Huapeng Chen and Adrian Walton
Outline • Background • Introduction • Objectives • Study area • Data and method • Results • Discussion • Conclusions
Background • A part of the research project “Integration of the satellite Year of Death (YOD)mapping data into the provincial BCMPB model”
Introduction • Life cycle of MPB
Introduction • Attack stages based on signs and symptoms • Green-attack • Green and greenish yellow needles • between the attack and June following the attack • Red-attack • Orange and red needles • July and August following the attack • Gray-attack • Lost of needles • About 3 years following the attack
Introduction • In BC, at provincial level, available data to map MPB red-attack damage • Aerial overview survey data • Satellite Year of Death data • Orthophoto interpretation data
Introduction • Aerial overview (sketch mapping) survey data • Spatial extent (coverage): province • Temporal scale: 1914 up to present • Spatial scale: 1: 100, 000 to 1: 250, 000 • Severity estimation: yes, based on a representative polygon drawn on a topographic map
Introduction • Aerial overview survey data • Severity classes • T (Trace, < 1%) • L (Light, 1 – 10%) • M (Moderate, 11 – 30%) • S (Severe, 31 – 50%) • V (Very severe, 51 – 100%)
Introduction • Satellite Year of Death data • Spatial extent (coverage): province • Temporal scale: 1999 to 2007 • Spatial resolution: 30 metre • Severity estimation: No • Possible year that red-attack occurred for each pixel
Introduction • Vegetation reflectance
Introduction • Enhanced Wetness Difference Index Larger than threshold mark as year of death
Introduction • Orthophoto interpretation data • Spatial extent (coverage): parts of province • Temporal scale: 2005 • Spatial scale: 1 : 20, 000 • Severity estimation: yes, based on a VRI polygon
Introduction • Orthophoto visual interpretation • Severity classes: • Trace (T, < 11%) • Moderate (M, 11 – 30%) • Severe (S, 31 – 50%) • Very severe (V, > 50%)
Introduction • Quick review of red-attack mapping data
Introduction • Information on severity of red-attack infestation at stand level is crucial to: • Stand susceptibility assessment • Timber supply analysis • Sanitation harvesting planning • Forest modeling
Objectives • Is the YOD data a good alternate to the Overview survey data to estimate red-attack severity at the stand level?? • The accuracy assessment of the YOD - How good is the YOD data? • With the orthophoto interpretation data as a reference (basis line), does the YOD data match the orthophoto interpretation data better than the overview survey data, in term of the severity estimates? • Is the match or agreement either between the YOD or the overview data and the orthophoto interpretation data affected by stand structure characteristics? and how??
Study area A: area of overlap between YOD and Orthophoto A B B: area of overlap between Overview and Orthophoto
Data and methods • Data • Aerial overview survey data 2005 (MFR, Forest Practice Branch) • Satellite Year of Death data 2005 (Version one, MFR, Forest Analysis and Inventory Branch) • Orthophoto interpretation data 2005 (MFR, Forest Analysis and Inventory Branch)
Methods How good is the YOD data?? • Accuracy assessment of the YOD data • Assessment area: west Williams Lake TSA • Assessment year: 2005 • Validation sample points (359) • From orthophotos
How to create validation points? For both purepine and pineleading stands: SV: 200 points TM: 300 points Validation point
How to measure accuracy of YOD? Methods Proportion of validation samples correctly identified by the YOD mapping data • Accuracy assessment of the YOD • Accuracy measurements • Error matrix – Producer’s accuracy Just a example here!
Validation sample layer How is a validation sample CORRECTLY identified by the YOD? Two buffer sizes: 15 metres 25 metres C D
Intersection types: Type I: any buffered validation box overlapping or touching the YOD red-attack pixels (A, B, C, and D) Type II: any buffered validation box which cumulative overlapping areas are equal or greater than one Landsat satellite image pixel size, 900 square metres A B C D
Methods Does the YOD data match the orthophoto interpretation data better than the overview survey data, in term of the severity estimates? • Data comparison • Area: area of overlap • Year of red-attack data: 2005 • Reference data: orthophoto interpretation data • Method integrating the YOD and overview survey data into forest stands (VRI polygons): polygon decomposition approach • User’s accuracy to measure the agreement in a red-attack severity class between two datasets
M:75ha, S:10ha, NoData:15ha Middle value for M, S, and NoData: 20%, 40%, and 0% New severity estimate: 19% (75*20%+10*40%+15*0) New severity class, M, will be assigned to the VRI polygon Methods –data comparison • Polygon decomposition approach Assigned severity code: M Assigned severity code: V Aerial overview survey data The YOD data
Methods – data comparison Proportion of the VRI polygons labelled as one severity class by the aerial overview or YOD data, are actually that severity class as determined by the orthophoto data • User’s accuracy Just a example here!
Methods • Impacts of stand structure characteristics on the agreement in a severity class • Simple correspondence analysis • Is the agreement in a severity class significantly related to a particular stand structure variable class?? • Stand structure characteristics: stand size, leading lodgepole pine composition, crown closure, and age • Severity classes: T, M, S, V, TM, and SV
Results • Accuracy assessment of the YOD data
Results – accuracy assessment of YOD • Accuracy assessment of the YOD data • Producer’s accuracy: 48.2±5.2% to 73.9±4.6% • Red attacks were more accurately detected by the YOD data in pure pine stands than in pine leading stands • Red attacks were more accurately detected by the YOD data in severely infested stands than in lightly infested stands
The aerial overview survey data match the orthophoto interpretation much better than the YOD data, for both individual and combined severity classes Results – Data comparison • Data comparison TM T T SV M SV S YOD Overview
Results • Impacts of stand structure characteristics • Y the agreement in a severity class YOD and orthophoto interpretation data • Total variance for the first two dimensions: 96.3% and 89.7% from the first dimension • Higher agreement in S or SV more likely occurs in middle age class (124-171 yrs) pure pine stands with higher crown closure (>65%) YODST1: pure pine YODSA3: age 124-171 yrs YODSC4: crown closure 50-66% YODSC5: crown closure > 66%
Results • Impacts of stand structure characteristics on • Total variance for the first two dimensions: 97.5% and 91.4% from the first dimension • Higher agreement in S or SV more likely occurs in pure pine stands with a larger size (> 54 ha) Aerial overview survey and orthophoto interpretation data OVST1: pure pine OVSS6: stand size >90 ha OVSS5: stand size 55-99 ha
Discussion • Why does the aerial overview survey data match the orthophoto interpretation data much better than the YOD data? • Similarity in technical approaches used by the aerial overview survey and orthophoto interpretation data
Discussion • Why does the aerial overview survey data match the orthophoto interpretation data much better than the YOD data? • Similarity in technical approaches used by the aerial overview survey and orthophoto interpretation data • Higher misclassification in lightly infested forest stands for the YOD data • Increased spectral confusion • Condition of forest stands
Stronger spectral signature Weaker spectral signature Lightly infested stand Severely infested stand
More background noise SV stand TM stand
Discussion • Why does the aerial overview survey data match the orthophoto interpretation data much better than the YOD data? • Similarity in technical approaches used by the aerial overview survey and orthophoto interpretation data • Higher misclassification in lightly infested forest stands for the YOD data • Increased spectral confusion • Condition of forest stands • Data gaps with the YOD data
Conclusions • Discrepancies in the red-attack severities estimated from different data sources are significant, particularly for the severe infestation classes, S and V • It may be inappropriate to assign a subjective severity code to a VRI polygon based on the percentage of the YOD pixel coverage in a VRI polygon