Download
1 / 15
160 likes | 269 Views
Explore disparities in a divided Chicago, where poverty, crime, education, health, and access to resources vary greatly between areas. Uncover demographic imbalances and their impact on the city. Unveil the inequality through maps and data analyzed by Michael Stiehl.

E N D
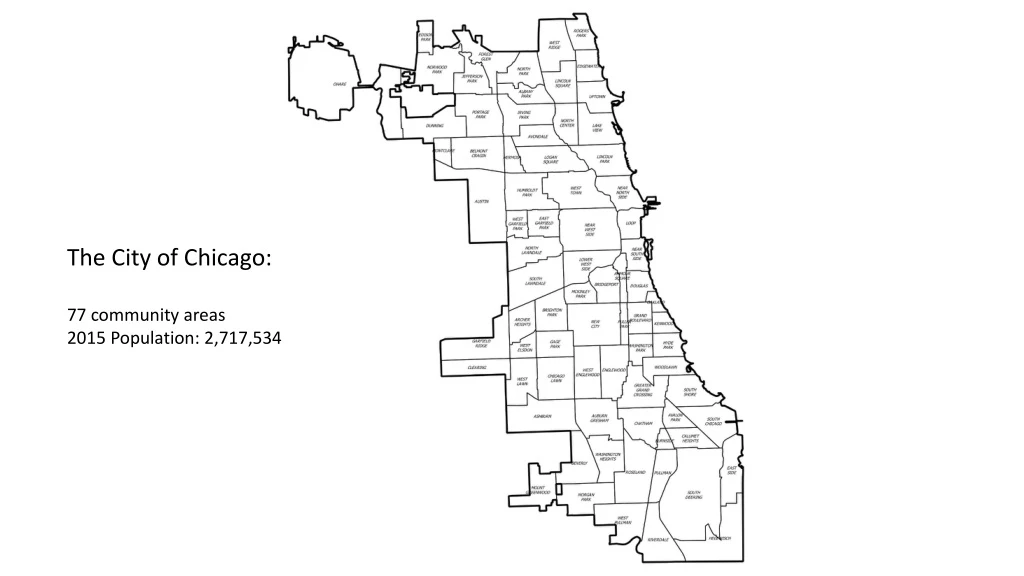
The City of Chicago: 77 community areas 2015 Population: 2,717,534
Racial and ethnic geography Maps created by: Michael Stiehl
Study Area: The part of Chicago where the White population is less than 10%. The Study Area makes up approximately 41% of the city’s population. Maps created by: Michael Stiehl
Poverty The poverty rate in the Study Area is 32% or double that of the remainder of Chicago. Maps created by: Michael Stiehl
Crime The violent crime rate is 350% higher in the study area than in the remainder of Chicago. Maps created by: Michael Stiehl
Educational Attainment Elementary school students in the study area perform on standardized tests at the 38th percentile vs. the 67th percentile for the remainder of the City. Maps created by: Michael Stiehl
82% of the 49 CPS school closures in 2013 were within the study area. Maps created by: Michael Stiehl
Health 28% of Study Area residents are uninsured. This is 75% higher than the remainder of Chicago based on 2014 data. Maps created by: Michael Stiehl
Access to Jobs 22% of the Study Area population faces commutes to work in excess of 60 minutes, a rate that is 70% higher than the remainder of Chicago. Maps created by: Michael Stiehl
Access to Arts Education Of the 387 arts organizations in Chicago doing work within Chicago Public Schools, only 13% of them are headquartered within the Study Area. These numbers reflect arts organizations within the boundaries of the City of Chicago that worked with schools in CPS and provided headquarter information to Ingenuity. Maps created by: Michael Stiehl
Field Foundation grants Between January 2015-January 2017 28% were headquartered in the Study Area. Maps created by: Michael Stiehl
Two Chicagos Maps created by: Michael Stiehl
Media Organizations: Of the 74 media organizations in Chicago approximately one third are in the study area.
Media Funding: Over ten years time, only 6% of grant funding was awarded to organizations inside of the study area.
Funding Gap: This translates into $60 million less in funding for ALAANA media organizations.