Download
1 / 18
180 likes | 196 Views
Learn about motion, speed, velocity, and acceleration with practical examples and calculations. Understand how to interpret motion graphs and analyze distance-time graphs. Practice problems provided for better comprehension.

E N D
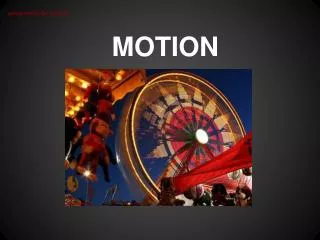
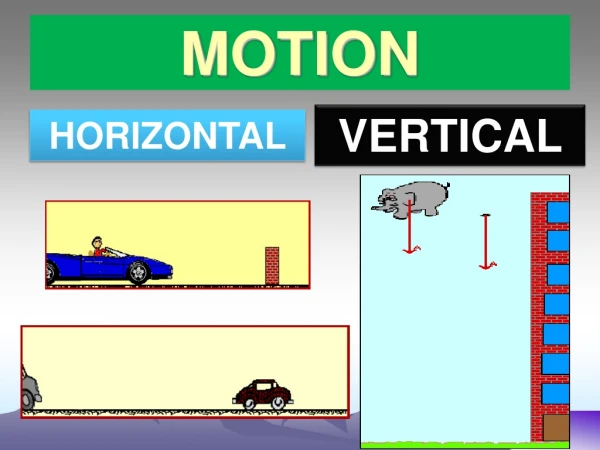
MOTION Speed, Velocity and Acceleration
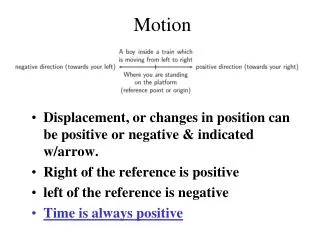
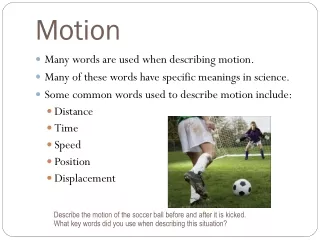
Motion • A change in position measured by distance and time.
Reference Point • A place or object used for comparison to determine if something is in motion. So…a fly is sitting on the shoulder of a man sitting in a car. The car is traveling at 60 mph. Is the fly in motion?
Speed • The rate at which an object moves. • Speed is the distance traveled in a given amount of time • Speed = distance time • Units= m/sec, km/hr
Calculating Speed • Problem: What is the speed of a car that travels 100 miles in 2 hours? • Solution: • S=d t S=100mi 2hr S=50mph
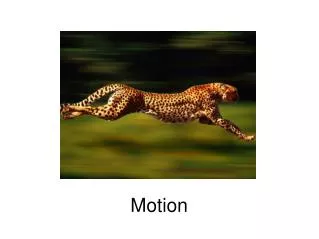
Velocity • The speed and direction of a moving object. • Ex. The cheetah’s velocity is 70 mph east
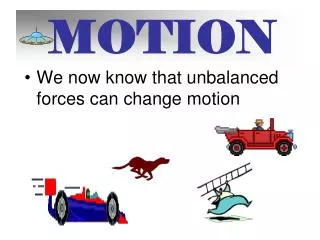
Acceleration • The rate at which speed or direction changes. • Acceleration occurs anytime an object's speed increases, decreases, or changes direction. • Positive acceleration: anobject speeds up • Negative Acceleration: (or deceleration) an object slows down • Zero Acceleration: an object moves at a constant velocity or the object has no motion.
Calculating Acceleration • Acceleration= final velocity-initial velocity time
Practice Problem • A train traveling at 10m/s slows down to a complete stop in 20s. What is the acceleration of the train? • SOLUTION: A= FV-IV T A= 0 m/s-10m/s 20s A= -10m/s 20s A= -.5m/s2
Key Points • A straight line shows constant speed. • A curved line shows average speed. • A horizontal line shows no motion. • Time is on the x-axis, distance is on the y-axis. • The steeper the graph, the faster the motion.
Distance-Time Graphs • Time is always on the x-axis. Distance is always on the y-axis.
No Motion • Time is increasing, but distance does NOT change. • It is NOT MOVING…NO MOTION…ATREST.
CONSTANT SPEED • Time and distance are INCREASING at a constant rate. This graph shows CONSTANT SPEED.
FASTER SPEED • A steeper line shows greater distance traveled in a given time. The STEEPER THE LINE, the HIGHER THE SPEED.
ACCELERATION • In a given time, the distance the object moves is getting larger, it is ACCELERATING.The curve upward shows an INCREASE in SPEED.
DECELERATION • This graph is the same as above, but the curve downward shows DECELERATION or a DECREASE IN SPEED.