Download
1 / 30
300 likes | 583 Views
Fales River Flood Modeling. Brett Andrews. Purpose. The purpose of this project is to analyze historic flood data and to show the extents of the floods based on the elevation of the terrain derived from LiDAR . The years that will be focused on are: 1977, 2008, 2009, and 2010. .

E N D
Fales River Flood Modeling Brett Andrews
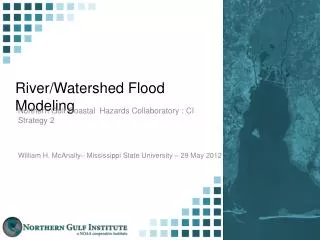
Purpose The purpose of this project is to analyze historic flood data and to show the extents of the floods based on the elevation of the terrain derived from LiDAR. The years that will be focused on are: 1977, 2008, 2009, and 2010.
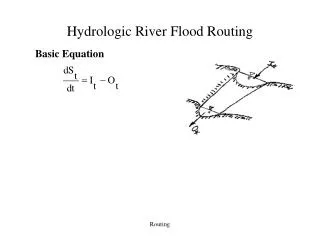
Cross Sections • The following cross sections were created using the 3D Feature to Attribute tool, for the water height and the Interpolate Shape for the Ground. • Two types of profile graphs • Stream Centerline height at ground and Flood height. • Cross Sections across the river with 1977 and 2010 and the Ground DEM
Basemap • The basemap data was digitized from a 1:2000 Land Registration and Information Services • Building were updated using a 2008 Air Photo and missing buildings and roads were added using deflection to create 90 degree corners and perpendicular roads.
Flood Extents 1977 & 2010 • The following map is showing the 1977 and the 2010 floods overlaid on the basemap. • The cross sections are labeled with the heights of the 2010 flood.
Hydraulic Gradient Tin and Raster • Tin • The next 2 maps are showing a gradient tin from slowest to deepest parts of the flood as it followed the river • Raster • The raster was created from the Tin and is symbolized based with a gradient fill
Past Flood Extents • The next series of map will show the flood extents from the past 4 biggest floods • 1977, 2008, 2009, 2010 • The floods are layered over the basemapwith the river sitting on top to clearly see the extents of each flood
ArcScene Composition • The next image is showing the 1977 and 2010 flood extents overlaid on the LiDAR DEM and the base map. • The Basemap was draped on top of the LiDAR data and the building heights were extracted to make the map 3D
Model Builder • The Model was created to automate the Flood Polygon creation • A series of tools were called on in the model
Conclusion • Create flood models from historical flood data • Created flood extent maps for Raster, Tins and Polygon • Profile graphs were created to show the height of the water based on the Ground data • ArcScene was used to visualize the flood in 3D
Sources • Urban Map: Land Registration and Information Services 1:2000. Mapsheet GREENWOOD- 0244960064920 • LiDAR data gnd345_49792m • Photos: Supplied by Mark Hebert • Software: ESRI ArcGIS Spatial Analysis and 3D Analysis Suits.