Download
1 / 13
130 likes | 271 Views
Smith (1986) Raising Capital. Table 1: Stock market’s reaction to announcements of security offerings of various types Industrial/HI Growth Utility/LOW Growth Common stock -3.14% -0.75% Preferred stock -0.19* 0.08* Convertible pref. stock -1.44 -1.38

E N D
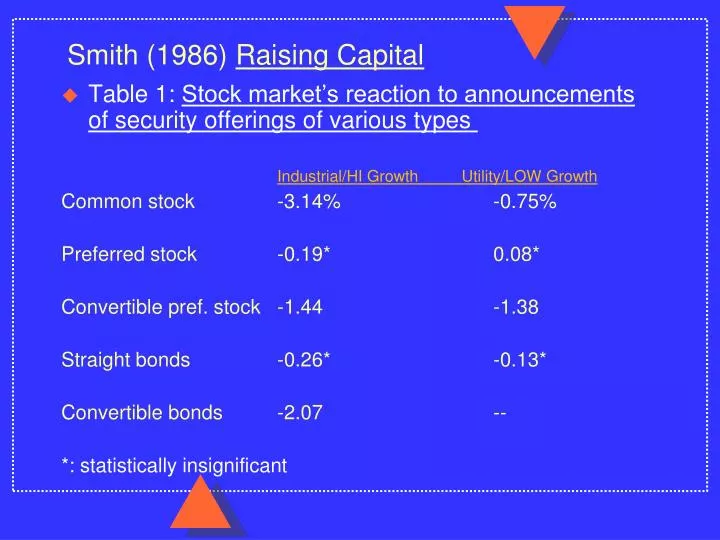
Smith (1986) Raising Capital • Table 1: Stock market’s reaction to announcements of security offerings of various types Industrial/HI Growth Utility/LOW Growth Common stock -3.14% -0.75% Preferred stock -0.19* 0.08* Convertible pref. stock -1.44 -1.38 Straight bonds -0.26* -0.13* Convertible bonds -2.07 -- *: statistically insignificant
Table 1: Stock market’s reaction to announcements of security offerings of various types • Average abnormal returns are non-positive. • Abnormal returns associated with common stock offerings are negative and larger in magnitude than those associated with preferred stock or debt. • Abnormal returns associated with convertible securities are negative and larger in absolute magnitude than for the corresponding non-convertible security. • Abnormal returns associated with sales of securities by high-growth companies are negative and larger in absolute magnitude than those for low-growth companies .
Three hypotheses can potentially explain the above market reaction to new security offerings. • Optimal Capital Structure • There is an optimal debt-to-total capital ratio for a company. • Deviations from this optimal debt-to-total capital ratio will decrease company value. • (Question: Why would managers ever deviate from the optimal debt-to-total capital ratio?)
Debt-Value Function: Movements along the curve. • D0 to D1: Issuing equity. Company value goes down. Consistent with empirical evidence. • D0 to D2: Issuing debt: Company value goes down: Evidence inconsistent with data. V0 Value of Company V1 V2 D1 D0 D2 Debt/Total Capital
Debt-Value Function: Shift of the curve. • Movements along the leverage value function cannot be differentiated from shifts in the function. • Hence, hypothesis is not very useful. V0 Value of Company V1 V2 D1 D0 D2 Debt/Total Capital
Implied Changes in Net Operating Cashflow • Firm’s cashflow identity: Market is trying to estimate net income by assuming only one other variable in the equation changes and the other four stay constant. • Table 2: Implied increase (decrease) in net income increases (decreases) share price. • New debt + New equity + Net income = • Interest payment + Dividend + New investment
Table 2: Implied increase (decrease) in net income increases (decreases) share price. Type of Announcement 2-day Return (%) Implied INCREASE in expected cashflow Common Stock Repurchases Intra-firm tender offer 16.2% Open mkt. Repurchase 3.6 Dividend Increases Dividend initiation 3.7 Dividend increase 0.9 Special dividends 2.1 Investment increases 1.0
Table 2: Implied increase (decrease) in net income increases (decreases) share price. Type of Announcement 2-day Return (%) Implied DECREASE in expected cashflow Security sales Common stock -1.6% Preferred stock 0.1* Convertible preferred -1.4 Straight debt -0.2* Convertible debt -2.1 Dividend decreases -3.6 Investment decreases -1.1
Implied Changes in Net Operating Cashflow • Explains non-positive market reaction to new equity offerings. Does not explain differential reaction to • debt and equity • convertible and non-convertible • high-growth and low-growth companies .
Information Asymmetry • Market analysts are less well-informed about a firm’s intrinsic value than managers. • Managers will issue equity if • Funds are needed to finance a very high positive NPV project. • Firm’s stock is overvalued in the market. • Market assumes that managers are issuing equity, because the stock is overpriced. • Explains negative market reaction to equity offerings.
Information Asymmetry (continued) • Since debt and preferred stock are more senior claims to equity, their value is less sensitive to changes in firm value. • Explains less negative market reaction to debt and preferred. • High-growth companies have greater information asymmetry. • Explains less negative market reaction to low-growth companies.
Information Asymmetry (continued) • Since debt and preferred stock are more senior claims to equity, their value is less sensitive to changes in firm value. Value of Debt Claim X Firm Value Value of Equity Claim X = Face Value of Debt X Firm Value
Two hypotheses explain most of the market’s reaction to new security offerings. • Implied Changes in Net Cashflow • Information Asymmetry