Download
1 / 25
420 likes | 1.14k Views
PETREL 2000. PETREL INTRODUCTION G&G. SCHLUMBERGER. Objective. Data Interpretation and Analysis using Petrel – 2D Seismic data visualization and interpretation – Interpretation of structure (e.g. faults) – Stratigraphic correlation – Velocity modeling

E N D
PETREL 2000 PETREL INTRODUCTION G&G SCHLUMBERGER
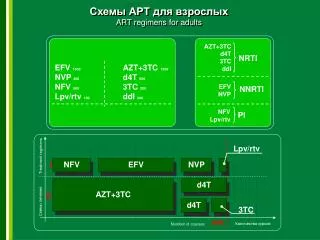
Objective • Data Interpretation and Analysis using Petrel – 2D Seismic data visualization and interpretation – Interpretation of structure (e.g. faults) – Stratigraphic correlation – Velocity modeling • Materials (Courtesy: 2011 IBA team University of Alabama) • 13,385 km2 study area • 15 2-D time migrated seismic lines (1981 vintage) • 7 wells (2 TD in basement) • Well seismic ties >32 km
Petrel Key Benefits • Facies Modeling • Petrophysical Modeling • Data Analysis • Uncertainty Analysis • Optimization • Workflow editor • Fracture Modeling • Volume Calculation • 3D well design • Streamline simulation • ECLIPSE Simulation • Simulation post-processing • Remote Simulation Run submission • Plotting • 3D visualization • Well correlation • Classification and Estimation (Artificial Neural Net) • Creation of synthetic seismograms • Seismic attributes • Geobody Interpretation • 2D & 3D seismic interpretation and modeling • Seismic volume rendering and extraction • 3D mapping • 3D grid modeling for geology and reservoir simulation • Velocity Modeling (Domain Conversion) • Well log upscaling
Project Coordinate System File New Project
Select Project Coordinate System Helpful website to get an overview on Geodetic Datum http://www.colorado.edu/geography/gcraft/notes/datum/datum_f.html
Import Base Map • Bitmaps (bmp, jpg, tiff) can be imported and visualized in Map Window • Save a map from Google Earth • Insert new folder in the input pane Rename as map Right click Import on Selection • Right click on the image Settings Settings input Lat-Long data
Import Well Logs (3 steps) • 1. Well head • An ASCII file (EXCEL file saved as .txt-tab dilimited) must be created with following required attributes • Well Name • X coordinate • Y coordinate • Kelly Bushing (Elevation datum) • Bottom Depth • TD (True vertical Depth)
Depth Reference/Depth Datum Objective Q/A Search “Schlumberger Oilfield Glossary” in Google website : http://www.glossary.oilfield.slb.com/default.cfm Search for following terminologies a. Depth Reference or Depth Datum b. Kelly Bushing c. Rig Floor d. Measured Depth e. True Vertical Depth Figure Courtesy http://www.cdc.gov/niosh/face/stateface/ok/03ok034.html
Seismic Data Visualization Right click on seismic line Create Interpretation Window The seismic interpretation window gives you a classic 2D view of the seismic data. Inline, crossline, composite lines and any type of random lines, can be displayed in the interpretation window. All interpretation tools are available in this window and the view can be zoomed, stretched and squeezed in either direction.
Seismic Data Visualization: Composite Lines <--Start new composite line to draw more than one composite lines
Seismic Data Visualization: Composite Lines 2. Select orthogonal view 3. Select composite section 4. Select the lines to be added into the composite section (become bold white), double click when you are done with adding lines 5. Composite folder will be created automatically in the input pane 1. Check following seismic lines 1981 D-81_Amplitude, 1981 B-81_Amplitude, 1981 A-81_Amplitude, 1981 27-81_Amplitude, 1981 16-81_Amplitude 2 5 4 3
Horizon picking Right click on 1981 27-81_Amplitudes Create interpretation window Insert New folder Right click Insert seismic horizon New horizon will be added “Seisimic Horizon 1” and be activated (bold) Click on choose from the following options Interpret Grid Horizons [H] Seeded 3D autotracking [Shift +A] Seeded 2D autotracking [A] Guided autotracking [G] Manual interpretation [U]
Fault picking • Two ways to interpret faults: • Classical interpretation (drawing fault segments) in the seismic interpretation • - flexibility of traditional interpretation • - clarity of fault planes triangulated in 3D • Fault modeling directly on the seismic in 3D process • - ready for gridding as soon as the interpretation is complete. • - interpreter is forced to solve problems regarding fault hierarchy and connections • - no need for reinterpretation before fault modeling