Download
1 / 25
260 likes | 477 Views
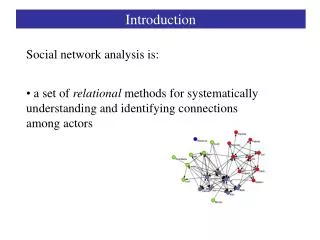
basic concepts and techniques. SOCIAL NETWORK ANALYSIS. Network Graph Clustering Filtering Graph metrics. Methodology Interpretation Validation Aggregation. Sociology Roles Social values Social metrics Incentives. Creating, Storing, Sharing Data . Flickr – Social Engagements.

E N D
basic concepts and techniques SOCIAL NETWORK ANALYSIS
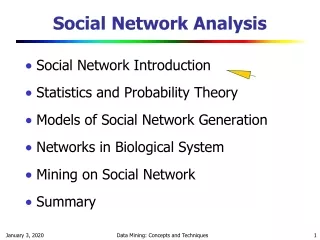
Network • Graph • Clustering • Filtering • Graph metrics • Methodology • Interpretation • Validation • Aggregation • Sociology • Roles • Social values • Social metrics • Incentives Creating, Storing, Sharing Data
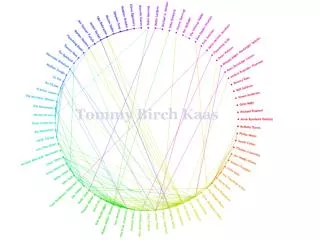
Human Super-Connectors Flickr users who commented on Marc_Smith’s photos (more than 4 times)
Human Super-Connectors Flickr users who commented on Marc_Smith’s photos (more than 4 times)
US Senate Voting Include only links that reflect more than 65% between two senators. NodeXL – Open source project. Extension of Excel for network visualization. http://nodexl.codeplex.com/
US Senate Voting Include party affiliation: Red for Republicants, Blue Democrats, 2 other parties. NodeXL – Open source project. Extension of Excel for network visualization. http://nodexl.codeplex.com/
E-mail Communication – Organization Units Email from TechABC High-traffic connections between organizational units > 50 messages per FTE. Color is mapped to Betweenness Centrality Green = bridge spanners. Excluded nodes with low Closeness Centrality Nodes within large connected components are shown.
The same data set in different layouts: • Fruchteman-Reingo • Grid • Spiral. 1 2 3
Fundamental issues Understanding of the tools that are applied Understanding of the applied analysis Understanding the relationship between the analysis and the layout algorithm used in visualization. • Visualization using Harel-Koren layout algorithm. • Sierpinski triangle is a fractal named after Waclaw Sierpinski who described it in 1915. • It is an example of self-similar sets, a mathematically generated pattern that is replicated at every level of reduction or magnification.
Large networks challenge human intuition and our technical ability to analyze and visualize data. Models learnt from data may not be in a representation that is suitable for human interpretation and modification. Computing specialist and domain experts need to work together to develop technologies, tools, and practices.
shaping the future REFLECTIONS
Designing Social Platforms and Measuring Social Engagement • Seemingly small decisions make huge differences in shaping the community • We need to develop tools, methods, and metrics to help us assess the state of the community • We need to understand and shape human values and devise incentives to encourage desired behaviour.
Social Participation - Early Steps College Park, MD, April 2009 Article: Science March 2009 Ben Shneiderman BEN SHNEIDERMAN http://iparticipate.wikispaces.com
Technology Mediated Social Participation Community Informatics Research Network www.tmsp.umd.edu
Social Media Research Foundation: smrfoundation.org SMRF supports projects on tools, collections, analysis & visualization of social media data. Create open tools Generate & host open data Support open scholarship.
Analyzing Social Media Networks with NodeXL I. Getting Started with Analyzing Social Media Networks 1. Introduction to Social Media and Social Networks 2. Social media: New Technologies of Collaboration 3. Social Network AnalysisII. NodeXL Tutorial: Learning by Doing 4. Layout, Visual Design & Labeling 5. Calculating & Visualizing Network Metrics 6. Preparing Data & Filtering 7. Clustering &GroupingIII Social Media Network Analysis Case Studies 8. Email 9. Threaded Networks 10. Twitter 11. Facebook 12. WWW 13. Flickr 14. YouTube 15. Wiki Networks www.elsevier.com/wps/find/bookdescription.cws_home/723354/description
Thank you! • Contact: • Natasa Milic-Frayling natasamf@microsoft.com • Integrated Systems http://research.microsoft.com/is • Microsoft Research Ltd. • Cambridge, U.K.