Download
1 / 32
330 likes | 728 Views
STA220 L0201 – October 1, 2013 Today: Random variables Their mean and variance The two most important random variables for us: Binomial (discrete) Normal (continuous) Thursday: conditional probability and Bayes rule with a special guest

E N D
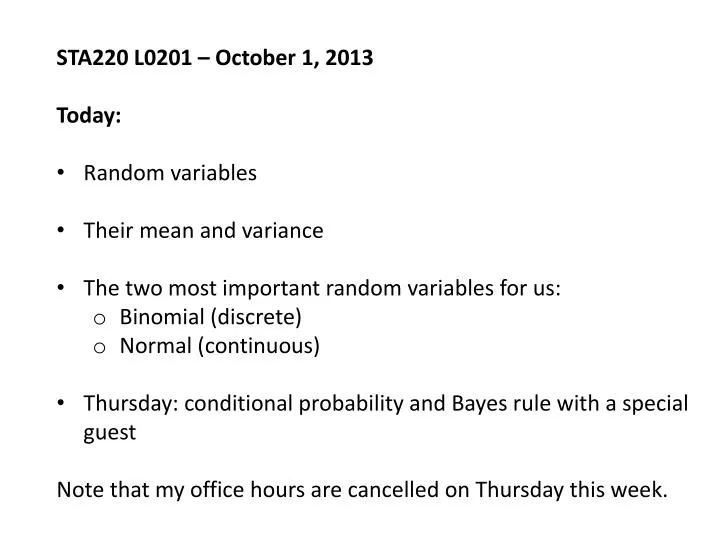
STA220 L0201 – October 1, 2013 • Today: • Random variables • Their mean and variance • The two most important random variables for us: • Binomial (discrete) • Normal (continuous) • Thursday: conditional probability and Bayes rule with a special guest • Note that my office hours are cancelled on Thursday this week.
The set of all possible outcomes of a random experiment is the Sample Space. Example: Suppose you’re writing an exam that consists of 20 multiple choice questions, each with 5 answer options. You guess for every question. The Sample Space: All of the possible combinations of right and wrong answers that could result. One element of the sample space: RRRWWWWWWWWWWRWRRWW
A random variable gives a number to every element of the sample space. Let X=number of correct answers on the exam For this element of the sample space: RRRWWWWWWWWWWRWRRWW X=6 X is an example of a discrete random variable because we can list all of the values it can be.
Random variables have probability distributions. For a discrete random variable, its distribution is the list of the probability of each of its values. For our example: P(X=0) = P(X=20) = P(X=10) =
X has a Binomial probability distribution. • Properties of a Binomial distribution: • A simple random experiment with two possible outcomes is repeated n times (n is fixed). • Each time it is repeated, there is a probability of “success”, p. • A Binomial(n,p) random variable is the count of the number of successes. • What probability distribution does the random variable X, the number of correct answers, have?
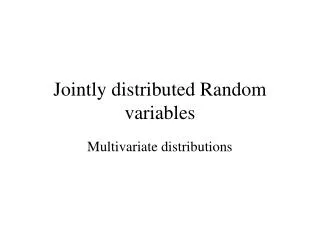
Binomial(20,.2) Distribution What is the probability that you pass?
Binomial(20,.2) Distribution How many correct answers do you expect to get?
Another use of the words “mean”, “variance”, & “standard deviation”: To describe the properties of a probability distribution.
Continuous random variables: can take on any value (real number) in an interval. Probabilities for continuous random variables are derived as areas under a “density function”.
The most important continuous probability distribution for us: • Normal(μ,σ2) • (a.k.a. the Gaussian distribution) • μ is the “centre” of the distribution. • If a random variable, X, has a Normal distribution, that is X~N(μ,σ2): • it can be any value from -∞ to +∞ • E(X)=μ • Var(X)=σ2
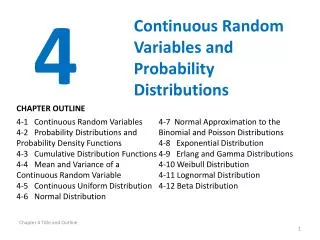
For a Normal random variable: The probability of being within one σ of μ is 68% The probability of being within two σ of μ is 95% The probability of being within three σ of μ is 99.7%
A standard Normal random variable, Z, has mean 0 and variance 1. Z~N(0,1)
An important application of the properties of Expectation and Variance: Suppose X~N(μ,σ2) X/σhas variance 1 X-μ has expectation 0 So (X-μ)/σhas the standard Normal distribution
Using the Normal probability table (for the standard Normal distribution)
Solving problems with the Normal distribution: Suppose X~N(10,4) WhatisP(X=8)?
Normal probability calculations: Draw a picture. Standardize. Get the corresponding values from the standard normal table.
Question 3.10 in OpenIntroStatistics Heights of 10 year olds, regardless of gender, closely follow a Normal distribution with mean 55 inches and standard deviation 6 inches. Sketch the answer for each of the following as the area under a standard Normal density function. What is the probability that a randomly chosen 10 year old is shorter than 48 inches? What is the probability that a randomly chosen 10 year old is between 60 and 65 inches? If the tallest 10% of the class is considered "very tall", what is the height cutoff for "very tall"? The height requirement for Batman the Ride at Six Flags Magic Mountain is 54 inches. What percent of 10 year olds cannot go on this ride?
Question 3.10 in OpenIntroStatistics Heights of 10 year olds, regardless of gender, closely follow a Normal distribution with mean 55 inches and standard deviation 6 inches. Sketch the answer for each of the following as the area under a standard Normal density function. What is the probability that a randomly chosen 10 year old is shorter than 48 inches?
Question 3.10 in OpenIntroStatistics Heights of 10 year olds, regardless of gender, closely follow a Normal distribution with mean 55 inches and standard deviation 6 inches. Sketch the answer for each of the following as the area under a standard Normal density function. b) What is the probability that a randomly chosen 10 year old is between 60 and 65 inches?
Question 3.10 in OpenIntroStatistics Heights of 10 year olds, regardless of gender, closely follow a Normal distribution with mean 55 inches and standard deviation 6 inches. Sketch the answer for each of the following as the area under a standard Normal density function. c) If the tallest 10% of the class is considered "very tall", what is the height cutoff for "very tall”?
Question 3.10 in OpenIntroStatistics Heights of 10 year olds, regardless of gender, closely follow a Normal distribution with mean 55 inches and standard deviation 6 inches. Sketch the answer for each of the following as the area under a standard Normal density function. d) The height requirement for Batman the Ride at Six Flags Magic Mountain is 54 inches. What percent of 10 year olds cannot go on this ride?
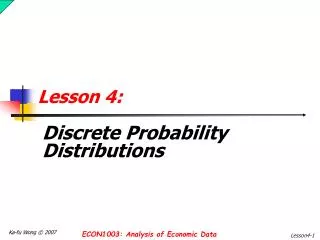
Which of these density functions shows a Normal distribution with a mean of 20 and a standard deviation of 4? A B C D