Download
1 / 13
130 likes | 241 Views
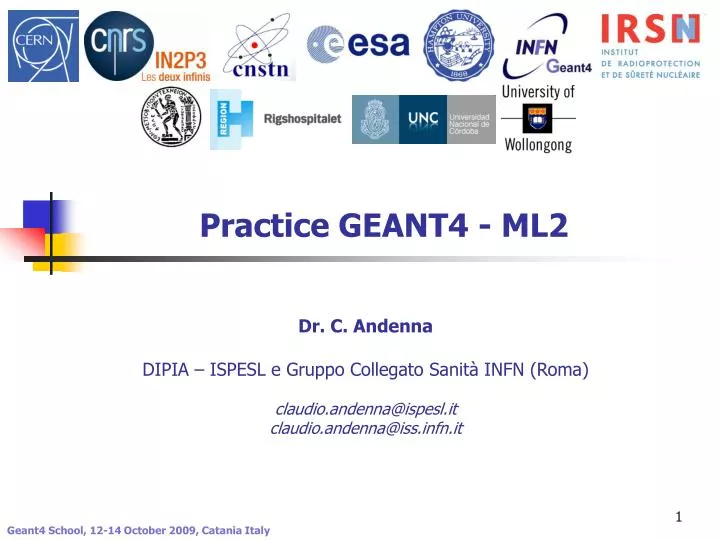
Practice GEANT4 - ML2. Dr. C. Andenna DIPIA – ISPESL e Gruppo Collegato Sanità INFN (Roma) claudio.andenna@ispesl.it claudio.andenna@iss.infn.it. Geant4 School, 12-14 October 2009, Catania Italy. Some aspects of the program. / primaryParticleData / idParticleSource 1

E N D
Practice GEANT4 - ML2 Dr. C. Andenna DIPIA – ISPESL e Gruppo Collegato Sanità INFN (Roma) claudio.andenna@ispesl.it claudio.andenna@iss.infn.it Geant4 School, 12-14 October 2009, Catania Italy
Some aspects of the program /primaryParticleData/idParticleSource1 switch (this->idCurrentParticleSource) { case idParticleSource_Random: this->GenerateFromRandom(); break; case idParticleSource_CalculatedPhaseSpace: this->GenerateFromCalculatedPhaseSpace(); break; } Geant4 School, 12-14 October 2009, Catania Italy
Some aspects of the program /primaryParticleData/idParticleSource 2 switch (this->idCurrentParticleSource) { case idParticleSource_Random: this->GenerateFromRandom(); break; case idParticleSource_CalculatedPhaseSpace: this->GenerateFromCalculatedPhaseSpace(); break; } Geant4 School, 12-14 October 2009, Catania Italy
Some aspects of the program • Dose calculation and its standard deviation In each voxel: Geant4 School, 12-14 October 2009, Catania Italy
Some aspects of the program • Dose calculation: • G4double depEnergy= aStep->GetTotalEnergyDeposit(); • voxelMass=density*voxels.halfSize.X*voxels.halfSize.Y*voxels.halfSize.Z; • dose=depEnergy/voxelMass; • Voxels.nEvents++; • voxels.depEnergy+=dose; • voxels.depEnergy2+=dose*dose; Geant4 School, 12-14 October 2009, Catania Italy
Content An overview of the results • Phase space data • Phantom voxelization • Comparison between experimental and calculated doses • Graphical view Geant4 School, 12-14 October 2009, Catania Italy
Phase space data • Type of data saved Geant4 School, 12-14 October 2009, Catania Italy
Phantom voxelization • Type of data saved Geant4 School, 12-14 October 2009, Catania Italy
Experimental vs Calculated data • Type of data saved % 6 MeV Tutte le misure gaf 10 luglio 2009 campo 3x3 n208=2; fh208=[ 0 10 3.10291e+07 10 758 2.73489e+07 ]; % x [mm], y [mm], z [mm], expDose [Gy], Calculated dose [Gy], Calculated dose2 [Gy^2], nEvents, normDose [Gy], normDoseError [Gy] d208=[ 0 0 -300 0.6644 5.93877e-09 1.01606e-18 49 0.184275 0.0170647 0 0 -290 4.3128 1.44254e-07 1.05554e-15 274 4.47607 0.972941 0 0 -258 2.7057 7.59039e-08 2.80751e-16 65 2.35523 0.433426 …. ]; Geant4 School, 12-14 October 2009, Catania Italy
Graphical view • Dedicated programs have to be used to generate the wanted graphs • We use matlab programs Geant4 School, 12-14 October 2009, Catania Italy
Graphical view: examples • Comparison between calculated and measured data Geant4 School, 12-14 October 2009, Catania Italy
Graphical view: 3D • Two examples of a section of the ROG Geant4 School, 12-14 October 2009, Catania Italy
Thank you ! Should you have any question, do not hesitate to contact us