Download
1 / 9
260 likes | 1.26k Views
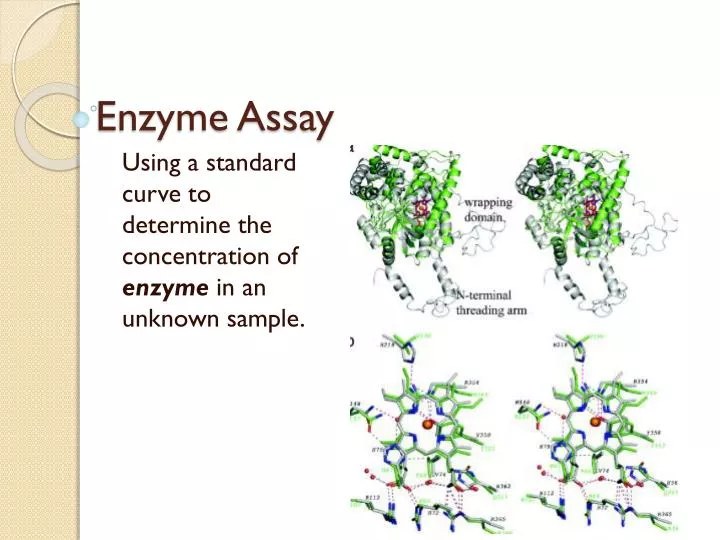
Enzyme Assay. Using a standard curve to determine the concentration of enzyme in an unknown sample. Examples of Standard Curves. What is the X axis? What is the Y axis?. How can a curve be used?. Predict unknown concentration when you test for the independent variable.

E N D
Enzyme Assay Using a standard curve to determine the concentration of enzyme in an unknown sample.
Examples of Standard Curves • What is the X axis? • What is the Y axis?
How can a curve be used? • Predict unknown concentration when you test for the independent variable. • “Assay”: analytic procedure to quantitatively measure the amount of activity in a sample. • Use the results of the “assay” to predict unknown concentration.
Our Model System • Catalase: • You are working for a drug company and you want to make a “generic” of the enzyme based drug another company produces. • You must determine how much of the active ingredient is present in the drug. • Your research in the papers suggests the concentration is between .1 and 10% (mass (g)/volume (ml)) • The closer to the exact amount you can come, the better your generic will work!
Model System • What does catalase do? • H2O2 H2O + O2 • What can you “assay” for?
Methods and Materials • Shared Materials: • Bottles of 6% and 3% H2O2 • 2 blenders (must be cleaned with soap at the end!) • 2 electronic balances • Individual Materials: • ~25 g liver—source of catalase • Conical tubes for reactions • 2-disposable pipettes • 2-1mL graduated pipettes • Weigh boats • 50 mL grad cylinder • 250 mL beaker
Importance of variables & controls • Could I design my own method to test the same IV and DV? • FOCUS: What would I need to know to exactly repeat your methods?
Your job (Monday and Tuesday) • Figure out the role of catalase in cell and why it is essential in cells. • Design a standard curve to assay for the concentration of catalase in an unknown sample. • Determine what type of best fit line fits your data. • Estimate the concentration. • Suggest a second run based on the information you found to further refine your value. • Connect the methods for this lab to a real-world problem.
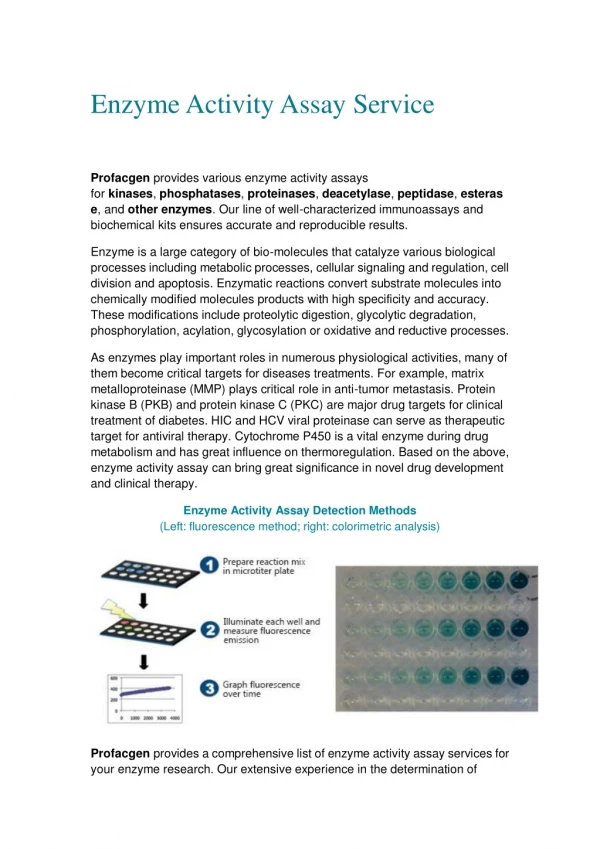
Is your curve usable? • Is your curve linear? Curved? How do you know if the curve you’ve chosen is acceptable? • Calculate “Y hat” • This is the Y value for each X if the equation is used (rather than having your values be plotted) • Residual = Yobserved-Yhat • Graph residuals vs. X. If there is no pattern, then the regression line captures the overall pattern. http://www.youtube.com/watchv=6HcyewrPNEw

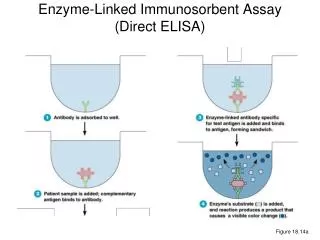
![Enzyme-Linked Immunosorbent Assay [ ELISA ]](https://cdn1.slideserve.com/2423074/enzyme-linked-immunosorbent-assay-elisa-dt.jpg)