Download
1 / 42
420 likes | 652 Views
Introduction of Lifecycle Funds by the Thrift Savings Plan. A case study James B. Petrick. TSP Facts and Statistics. Largest defined contribution plan in the world Over 3.5 million participants, serving employees of the U.S. Federal government, including all U.S. military personnel

E N D
Introduction of Lifecycle Funds by the Thrift Savings Plan A case study James B. Petrick
TSP Facts and Statistics • Largest defined contribution plan in the world • Over 3.5 million participants, serving employees of the U.S. Federal government, including all U.S. military personnel • Almost $180 billion in assets • Over 340,000 transactions each month
Annual Year-End BalancesG, F, C, S, and I Funds($ millions) $173,281 $152,009 $128,925 $99,312 $100,553 $97,686 $94,649 $77,268 $58,166 $44,889
What is the TSP? • Employee benefit plan – U.S. tax-favored arrangement. Not taxed on money contributed or on earnings until withdrawn • Defined contribution – Benefits are based solely on participant contributions and earnings • Participant-directed – Participants decide how much to contribute and how to invest • Like “401k” plans
What is the TSP’s purpose? • Provides retirement income that is complementary to the defined benefit component • For its core group (FERS), one part of a three-part retirement program • Defined benefit component • Social Security • TSP Originally estimated would match old system replacement ratios (56% of final three salary at 30 years and age 55), but not being tracked. • For other groups, supplements a full defined benefit
Why was TSP established? • Social Security reforms in 1983. Needed to include federal workers to enhance solvency • End “unfunded liability” of old defined benefit program • Increasing mobility of workforce required portability – you could take TSP to and from a private sector plan • Deficit reduction – Accounting gimmick kept government securities “on budget” - since changed
Investment Structure • Law requires use of index funds for equity options • Index funds are designed to follow entire markets or broad slices of markets • Ensures decisions are “passive” • “Active” decisions could be based on politics • Index funds are low cost • Board decided to use indexing for fixed income also
TSP Investment Options • G Fund – Specially issued government securities • F Fund – U.S. corporate and government bond index fund. Tracks the Shearson/Lehman Bros. Corporate Bond index • C Fund – Large capitalization U.S. stocks. Tracks the S&P 500 index • S Fund – Small to medium capitalization U.S. stocks. Tracks the Dow Jones Wilshire 4500 index • I Fund – International stocks. Tracks the EAFE index
Post-employment withdrawals • Three options: • Lump-sum payment • Phased withdrawals • Annuity • Can mix options • Transfer certain payments to IRAs or other plans • One-time partial withdrawal • Required to begin by age 70 ½
Annuities • Only an option (not required unless spouse insists) • 18 different annuity types (single life, joint and survivor, etc.) • TSP selects vendor and monitors performance. No liability once annuity is purchased • Annuity provider competitively procured • Insurance companies compete on price • Not yet a popular option, although numbers increasing
Knowledge, Interest, Time Studies show participants do not have: • Knowledge • Interest • Time to manage their portfolio allocations
Poor Allocation • TSP looked at their own statistics and found evidence of poor investment practices • Poor investment allocation by over 60% of participants • 38% invested only in G Fund; 13% only in C Fund • Another 12% had “barbell” investments – Totally G Fund and one other risky fund
Return Chasing • Participants are “chasing returns” • Investing in the fund with the best return or highest price last month or yesterday • Buying high and selling low
Not Rebalancing • In 2002, only 16% of TSP participants made an interfund transfer • Many participants never reallocate their accounts
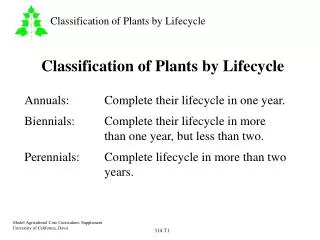
What Are Lifecycle Funds? • Target date asset allocation funds • Target date - when you begin to withdraw (not necessarily retirement date) • Target date farther away – higher risk investments • Target date closer – change automatically to lower risk investments
Compare With “Lifestyle” Funds • Investing style – “conservative” (low risk), “moderate” (medium risk) or “aggressive” (high risk) • Do not change over time. If you are getting near to retirement, you must change them yourself • Terms are not applied consistently. Sometimes you will hear lifecycle funds called “lifestyle” and vice versa
New Trend Current Trends • 55% of U.S. private sector plans now use these funds; number continues to grow • Up 20% in past 2 years • When offered, 10% of assets invested in these funds
Reasons TSP Chose Lifecycle Over Lifestyle • Size of plan requires simple approach – Not feasible to design or implement tailored solution for 3.5 million participants • Easier to communicate • No need for questionnaires about “your investing style” or “your tolerance for risk” • “ Turn-key” approach. No further action by participants needed • Simply choose a date when you want to begin withdrawing your money. Allocations change automatically over time to meet your needs • Matched assumed profile of those we wanted to reach – people who didn’t want to be involved in their investments
Risk profiles of TSP Funds “Risk” refers to how far annual returns vary from the average return over time. The more variance, the higher the risk. Here are the risk profiles for the five TSP funds: Range of Returns Bar Graph Return January 1988 - December 2003 Legend 20.0% 15.9% Highest: 15.6% 18.0% 16.0% 11.4% 14.0% 12.0% 10.0% 8.0% 3.8% 6.0% 0.8% 4.0% 2.0% 0.0% 0.2% -2.0% G Fund Actual Returns -4.0% -3.4% Average: -6.0% -8.0% F Fund Actual Returns -10.0% -12.0% -14.0% -13.8% -14.5% -16.0% -18.0% I Fund Composite Returns C Fund Actual Returns -20.0% -19.4% -22.0% S Fund Composite Returns -24.0% -26.0% -28.0% -30.0% Lowest:
Time Reduces Risk • Participants with longer time horizons can invest in higher risk funds, because time mitigates risk • As horizon shortens, portfolios can be adjusted to have lower risk investments
The Efficient Frontier • Allocations that achieve the greatest predicted return for a predicted level of risk are said to be on the “efficient frontier” • Based on predicted economic trends and investment performance. Historical results are only part of the prediction
The efficient frontier can be shown as a line representing all portfolios that yield the greatest returns at all levels of risk:
Lifecycle Fund Goal • More return for the same amount of risk, or • The same returns with less risk C Fund (1.06%) TSP (1.30%) G Fund
Obtained expert advice • After competitive procurement, Board hired Mercer Investment Consulting to advise us on: • Number of funds to use • Target dates for the funds • Asset allocation schedules for the life of the funds (to put investors nearer to the efficient frontier • Required to use only existing TSP investment options (statutory constraint) – Existing funds provided adequate diversification
Mercer’s process • Chose target participants – e.g., FERS participant who is currently 27 with a $7000 account, retiring at age 62. (Based on our demographic studies) • Mercer used its economic assumptions about asset classes to calculate risk and return of 5 funds. • Also developed correlation assumptions among asset classes represented by TSP funds.
Mercer’s process (continued) • Devised sample portfolios lying along efficient frontier (based on their economic assumptions about future performance) • Stochastic modeling of results for these portfolios over next 50 years under difference combinations of economic scenarios • Assumed participants would increase contributions over time and retire at age 62
The Recommended Funds • Five funds selected - 10 considered but rejected as too complex • Income Fund • For those already withdrawing their accounts • 2010 Fund • 2020 Fund • 2030 Fund • 2040 Fund
The TSP Lifecycle Funds • Funds with higher target dates, primarily equities (C, S, and I Funds) • Income Fund largely, but not entirely, invested in fixed income (G and F Funds) • Over time, as target date nears, fund allocations will move towards fixed income
Initial Lifecycle Fund Allocations 2010 2040 42% C Fund 18% S Fund 43% G Fund 27% C Fund 10% F Fund 7% F Fund 25% I Fund 5% G Fund 8% S Fund 15% I Fund
Lifecycle Allocation Schedules • The allocation schedules • Set up at the beginning • Will change at regular intervals • Will be reviewed and may be revised from time to time • Rebalance funds to the schedules
Initial Position of Recommended Lifecycle Funds on the Efficient Frontier Expected Geometric Return 2040 S-Fund 2030 2020 2010 C-Fund I-Fund Current Income F-Fund G-Fund Standard Deviation
Rolling Down the Efficient Frontier The fund with the farthest target date would “roll down the efficient frontier” until, at its target date, it would merge with the income fund. As each fund merges, a new one is created 2040 2030 2020 2010 INCOME RETURN RISK
Expected results • For 27 year old investing in L2040, at age 62: 4.76% median real return 14.61% standard deviation $1,630,000 median account balance with 57.6% replacement ratio $981,000 5th percent account balance with 34.2% replacement ratio (worst case scenario) .1% probability of decline in last 3 years
TSP Communications Strategy • Sought expert advice concerning communications rollout • Key idea – • “Up-front” choice between lifecycle funds and managing their own accounts. • “Two-path” or the “fork in the road” solution • Allows those who want to invest for themselves to continue
Participant Investment in a Lifecycle Fund • Participants not restricted in their use of L Funds • Can choose to invest in L Funds and other TSP funds • Can choose to invest in more than one L Fund • But -- present L Funds as a single fund solution if used as intended
Results (after 7 months) • 8% of FERS participants using L funds • 6% of assets invested in L Funds • L Funds assets are almost $10 billion • Different groups (by age, retirement system) appear to be using funds appropriately
Returns of L Funds vs. Underlying FundsInception (August 2005) to Date Income 2010 2020 2030 2040 G F C S I Underlying Funds L Funds
Future initiatives • Make L Funds the default funds • Requires statutory change