Download
1 / 21
220 likes | 425 Views
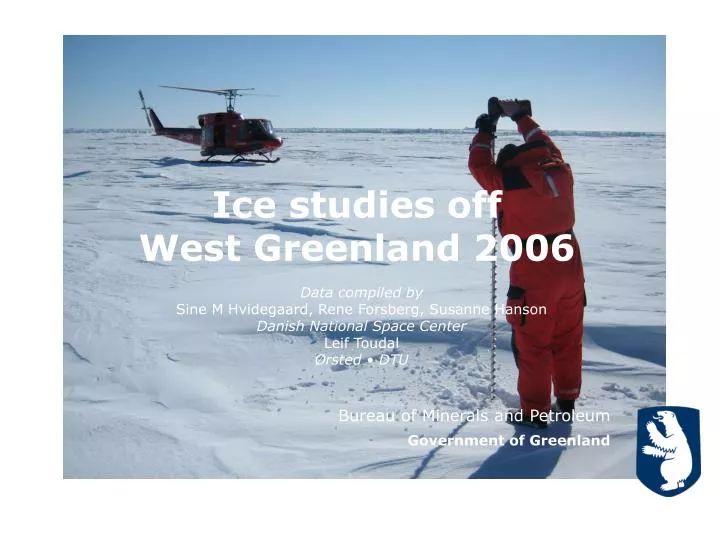
Ice studies off West Greenland 2006. Data compiled by Sine M Hvidegaard, Rene Forsberg, Susanne Hanson Danish National Space Center Leif Toudal Ørsted • DTU. Bureau of Minerals and Petroleum Government of Greenland. West Greenland ice studies 2006. Basic objectives

E N D
Ice studies off West Greenland 2006 Data compiled bySine M Hvidegaard, Rene Forsberg, Susanne HansonDanish National Space Center Leif ToudalØrsted • DTU Bureau of Minerals and Petroleum Government of Greenland
West Greenland ice studies 2006 Basic objectives • Measure ice thickness and ridging • Calibrate airborne measurements by in-situ drilling • Compile historic data on ice distribution and drift • Measurement of ice drift with buyo
QAARSUT T12 KANGERLUSSUAQ West-Ice flight tracks 21/25 April 2006
0.0 1.0 2.0 3.0 Laser ice thickness measurement -57.900 -57.880 -57.860 -57.840 68.014 68.012 m • Southern line – approx 3 km section. Numerous thick floes and ridges • The swath shows colour-coded sea ice thickness data including the snow depth on top of the ice
Laser ice thickness measurement . 71.025 71.020 -56.30 -56.28 -56.25 -56.32 m 0.0 1.0 2.0 3.0 Northern line – approx 2 km section. V10 is helicopter drill site position
1.39 m 70.6 % 1.40 m 80.0 % 1.19 m 67.6 % 1.23 m 66.0 % 1.10 m 65.8 % V5 – V6 2.13 m 77.2 % 1.78 m 83.3 % 1.28m 72.9 % V3 – V4 1.63 m 73.5 % 1.29 m 66.1 % V1 – V2 1.33 m 63.8 % 1.32 m 83.6 % Average laser ice thickness • Plot shows mean ice thickness for the E-W laser survey lines, for each 2° in longitude • Numbers shown are the average thickness in meter and the % of ice thickness above 80 cm. • The thickness includes snow depth and pressure ridge heights; floe ice thickness is therefore significantly less. • Average of helicopter measurements on flat floes: 65 cm, with 40% > 80 cm
40x40 m area selected corresponding approx. to in-situ measuring site Average of laser-scanner-derived ice thickness in area compared to average of drillings In-situ: 0.56 m Scanner: 0.79 m ± 0 .30 m (std. dev.) Large variation in area is the main cause of the difference In-situ ice-thickness measurements
In-situ: 1.05 m Scanner: 1.44 m In-situ: 0.56 m Scanner: 0.79 m In-situ: 0.96 m Scanner: 0.78 m In-situ/laser measurement comparison
End of the ice season (end of June) AMSR-E ICE 20050701 AMSR-E ICE 20060628
Distribution of sea ice 2004–2006 • Amimations of sea-ice distribution and cover 2004–05 (left) and 2005-06 (right) • Sea ice cover: Purple:~100 % Red: > 90 % Orange: > 70–85 % Yellow: > ~50 % Green: ~30 % Blue-green: 10–20 % Blue: no ice or noise
Drift of polar multi-year ice • Polar multi-year ice has a higher roughness than first-year ice – seen as bright green or yellow areas along the east coast of Canada • Note that this ice does not drift into Greenland waters
25-year statistics Average number of ice-free days Minimum number of ice-free days
Recent statistics Minimum number of ice free days Minimum number of ice free days 25-year statistics 2000–2005 statistics
Ice stations 2006/04/26 Sea ice studies 2006 Drift track 2006/04/26–2006/06/12
2006 drift buyo experiment Radar image June 12, 2006 50km 20060426 20060612
Ice drift in May Percentage of days in May where ice drift exceeds 10 km/day Yellow areas have few datapoints! • Comparison between buoy drift statistics 2006 and the 20 year satellite ice drift statistics • Good correspondence, but satellite may under-estimate extreme values 20-year average 2006 buoy
Oil production in ice-infested waters Sakhalin Caspian Sea Beaufort Sea Kara Priraz Pechora Sea White Rose