Download

1 / 23
230 likes | 244 Views
Learn about types of quantitative variables, histograms, measures of center, percentiles, and spread in this detailed lecture, concluding with practical examples and exercises to apply concepts effectively.

E N D
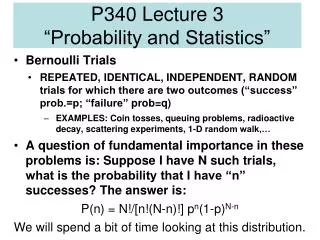
Last class: types of quantitative variable, histograms, measures of center, percentiles and measures of spread…well, we shall finish these today • Will have completed Chapter 1 • Assignment #1: Chapter 1, questions: 6, 20b, 26, 36b-d, 48, 60 • Some suggested problems: • Chapter 1: 1, 5, 13 or 14 (DO histogram), 19, 26, 29, 33
Measures of Spread (cont.) • 5 number summary often reported: • Min, Q1, Q2 (Median), Q3, and Max • Summarizes both center and spread • What proportion of data lie between Q1and Q3?
Box-Plot • Displays 5-number summary graphically • Box drawn spanning quartiles • Line drawn in box for median • Lines extend from box to max. and min values. • Some programs draw whiskers only to 1.5*IQR above and below the quartiles
Can compare distributions using side-by-side box-plots • What can you see from the plot?
Other Common Measure of Spread: Sample Variance • Sample variance of n observations: • Can be viewed as roughly the average squared deviation of observations from the sample mean • Units are in squared units of data
Sample Standard Deviation • Sample standard deviation of n observations: • Can be viewed as roughly the average deviation of observations from the sample mean • Has same units as data
Exercise • Compute the sample standard deviation and variance for the Muzzle Velocity Example
Variance and standard deviation are most useful when measure of center is • As observations become more spread out, s : increases or decreases? • Both measures sensitive to outliers • 5 number summary is better than the mean and standard deviation for describing (I) skewed distributions; (ii) distributions with outliers
Population and Samples • Important to distinguish between the population and a sample from the population • A sample consisting of the entire population is called a • What is the difference between the population mean and the sample mean? • The population variance ( or std. deviation) and that of the population • Population median and sample median?
Empirical Rule for Bell-Shaped Distributions • Approximately • 68% of the data lie in the interval • 95% of the data lie in the interval • 95% of the data lie in the interval • Can use these to help determine range of typical values or to identify potential outliers
Example…Putting this all together • A geyser is a hot spring that becomes unstable and erupts hot gases into the air. Perhaps the most famous of these is Wyoming's Old Faithful Geyser. • Visitors to Yellowstone park most often visit Old Faithful to see it erupt. Consequently, it is of great interest to be able to predict the interval time of the next eruption.
Example…Putting this all together • Consider a sample of 222 interval times between eruptions (Weisberg, 1985). The first few lines of the available data are: • Goal: Help predict the interval between eruptionsConsider a variety of plots that may shed some light upon the nature of the intervals between eruptions
Example…Putting this all together • Goal: Help predict the interval between eruptions • Consider a histogram to shed some light upon the nature of the intervals between eruptions
Example…Putting this all together • What does the box-plot show? • Is a box-plot useful at showing the main features of these data? • What does the empirical rule tell us about 95% of the data? Is this useful? • We will come back to this in a minute…
Scatter-Plots • Help assess whether there is a relationship between 2 continuous variables, • Data are paired • (x1, y1), (x2, y2), ... (xn, yn) • Plot X versus Y • If there is no natural pairing…probably not a good idea! • What sort of relationships might we see?
Example…Putting this all together • What does this plot reveal?
Example…Putting this all together • Suppose an eruption of 2.5 minutes had just taken place. What would you estimate the length of the next interval to be? • Suppose an eruption of 3.5 minutes had just taken place. What would you estimate the length of the next interval to be?