Download
1 / 61
610 likes | 790 Views
ELIMINATING HEALTH DISPARITIES IN AN URBAN AREA. VIRGINIA A. CAINE, M.D., DIRECTOR MARION COUNTY HEALTH DEPARTMENT INDIANAPOLIS, INDIANA May 1, 2002.

E N D
ELIMINATING HEALTH DISPARITIES IN AN URBAN AREA VIRGINIA A. CAINE, M.D., DIRECTOR MARION COUNTY HEALTH DEPARTMENT INDIANAPOLIS, INDIANA May 1, 2002
“Racial and ethnic disparities in health care are unacceptable in a country that values equality and equal opportunity for all. And that is why we must act now with a comprehensive initiative that focuses on health care and prevention for racial and ethnic minorities.” President Bill Clinton February 21, 1998
President’s Initiative to Eliminate Racial and Ethnic Disparities in Health Target conditions • Infant mortality • Cancer screening and management • Cardiovascular disease • Diabetes • HIV infection/AIDS • Immunizations
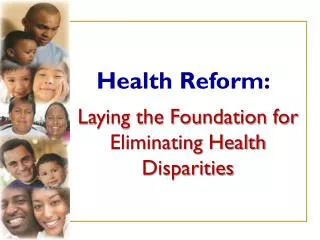
Healthy People 2010 Two Overarching Goals: • Increase Quality and Years of Healthy Life • Eliminate Health Disparities
What Are Health Disparities? • Differences in the incidence, prevalence,mortality, and burden of diseases and other adverse health conditions that exist among specific population groups in the United States.
Why The Interest In Disparities? • The changing demography of the American population • The persistence of disparities in the health status of racial and ethnic minorities
Percent Distribution of U.S. Population by Race and Ethnicity, 2000 Source: U.S. Census Bureau, 2000
American 12.2% Indian/Alaska Native 13.6% 11.4% Asian/Pacific Islander 24.5% Black/African American 71.8% Hispanic/Latino 52.8% White, not Hispanic/Latino Percent of the Population by Race and Hispanic Origin, 2000 and 2050 3.9% 8.2% 2000 2050 Source: U.S. Bureau of the Census 2000
Emerging Majorities Minority people are the majority in three states • California (50.1%) • Hawaii (71%) (53%) • New Mexico (71%) • District of Columbia
Emerging Majorities Minority people are now at least 30% of the population in ten states: • Texas (45%) • Arizona (32%) • Mississippi (38%) • Florida (32%) • Maryland (36%) • New Jersey (32%) • New York (35%) • South Carolina (32%) • Georgia (34%) • Nevada (30%)
1990 White, not Hispanic: 90.1% Black/African American: 7.8% Asian/Pacific Islander: 0.2% Hispanic/Latino: 1.7% American Indian/Alaska Native: 0.3% 2000 White, not Hispanic: 86.5% Black/African American: 8.3% Asian/Pacific Islander: 1.0% Hispanic/Latino: 3.6% American Indian/Alaska Native: 0.7% Percent of the Population by Race and Hispanic Origin, Indiana
0 Life Expectancy at Birth, 1900-1998 Years White 77.3 71.3 Black 47.6 33.0 1900 1950 1998 SOURCE: CDC/NCHS, National Vital Statistics Systems, 1900-98
Infant Mortality Rates, 1980-1998 22.2 14.3 10.9 6.0 Deaths <1 year/1000 live births SOURCE: CDC/NCHS, National Vital Statistics System, 1980-1998
Infant mortality rates by race and Hispanic origin of mother Total Hispanic Non-Hispanic white Non-Hispanic black Asian/Pacific Islander Deaths <1 year per 1000 live births SOURCE: CDC/NCHS, National Vital Statistics System, 1995
Infant mortality rates by Hispanic origin of mother Total Hispanic Mexican Puerto Rican Cuban Central/South American Deaths <1 year per 1000 live births SOURCE: CDC/NCHS, National Vital Statistics Systems, 1995
Infant mortality rates by Asian/PacificIslander subgroup Asian/Pacific Islander Chinese Japanese Hawaiian Filipino Deaths <1 year per 1000 live births SOURCE: CDC/NCHS, National Vital Statistics Systems, 1995
Coronary heart disease death rates 1990 White 1996 Black A/PI AI/AN Hispanic Per 100,000 population NOTE: Death rates are age-adjusted to 1940 standard million age distribution. A/PI is Asian American or Pacific Islander; AI/AN is American Indian or Alaska Native. SOURCE: CDC/NCHS, National Vital Statistics System, 1990 and 1996
Racial and Ethnic Disparities: Morbidity and Mortality • African American men have a 40 percent higher heart disease rate than White men • Women of Vietnamese origin in the United States suffer from cervical cancer at nearly five times the rate than White women
Racial and Ethnic Disparities: Morbidity and Mortality • Native Americans have a diabetes rate that is nearly three times the rate of Whites. The Hispanic rate is nearly double that of Whites • African American women are 28% more likely to die from breast cancer, although the incidence is greater in White women
Several Causal Factors • Socioeconomic status (SES) • Health risk behaviors • Psycho-social factors • Acculturation • Biologic/Genetic factors • Health care
Socioeconomic Status • Education • Occupation • Income • Environment • Culture
Infant Mortality Rates in the United States Deaths/1000 Live births Education in years SOURCE: CDC/NCHS/NVSS
Female Health Risk Behaviors White Current smokers Black Hispanic >1 oz. alcohol per day Regular exercise or sports percentage engaging in activity SOURCE: CDC/NCHS, National Health Interview Survey, 1990
Health Risk Behaviors Male White Black Current smokers Hispanic >1 oz. alcohol per day Regular exercise or sports percentage engaging in activity SOURCE: CDC/NCHS, National Health Interview Survey, 1990
> Age-adjusted Prevalence of Obesity (BMI 30.0) Female NHANES II Non-Hispanic Whites NHANES III Non-Hispanic Blacks Mexican Americans Percent SOURCE: CDC/NCHS, Second National Health and Nutrition Examination Survey, 1976-80 Third National Health and Nutrition Examination Survey, 1988-94
> Age-Adjusted Prevalence of Obesity (BMI 30.0) Male NHANES II NHANES III Non-Hispanic Whites Non-Hispanic Blacks Mexican Americans Percent SOURCE: CDC/NCHS, Second National Health and Nutrition Examination Survey, 1976-80 Third National Health and Nutrition Examination Survey, 1988-94
Psychosocial Factors • Large complex literature relating factors such as stress and discrimination with racial/ethnic differences in hypertension
Acculturation Some health behaviors “worsen” with acculturation
Percentage Uninsured Under Age 18 United States Percent of Population Source: CPS, USCB
Health Care Coverage of Persons Under 65 (Age-adjusted) Private All Hispanic Medicaid/ Public Assistance NH White NH Black Not covered Asian/PI Percent SOURCE: CDC/NCHS, National Health Interview Survey, 1996
Health Care Extensive evidence of racial and/or ethnic Differences in utilization of health care • Diagnostic tests and procedures • Therapeutic procedures • Intensity of care • Pain control • Transplants • Preventive services
Possible Explanations for the Racial and Ethnic Differences in Utilization • Socioeconomic status • Language • Insurance status • Severity of illness • Patient health behaviors • Provider bias